
Page 127 - Honorable Mayor and Members of the City Council
P. 127
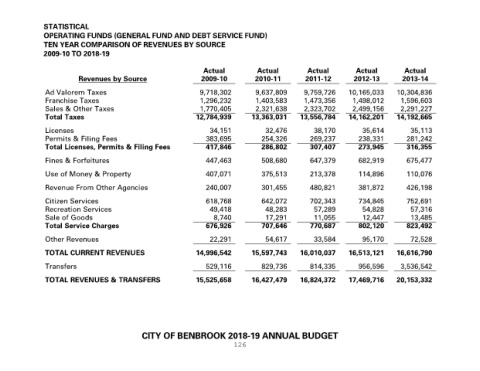
STATISTICAL
               OPERATING FUNDS (GENERAL FUND AND DEBT SERVICE FUND)
               TEN YEAR COMPARISON OF REVENUES BY SOURCE
               2009-10 TO 2018-19

                                                                    Actual            Actual           Actual          Actual          Actual
                           Revenues by Source                      2009-10           2010-11          2011-12         2012-13         2013-14

                Ad Valorem Taxes                                   9,718,302         9,637,809       9,759,726      10,165,033      10,304,836
                Franchise Taxes                                    1,296,232         1,403,583       1,473,356       1,498,012       1,596,603
                Sales & Other Taxes                                1,770,405         2,321,638       2,323,702       2,499,156       2,291,227
                Total Taxes                                       12,784,939        13,363,031   13,556,784   14,162,201   14,192,665

                Licenses                                              34,151             32,476          38,170          35,614          35,113
                Permits & Filing Fees                                383,695           254,326         269,237         238,331         281,242
                Total Licenses, Permits & Filing Fees                417,846           286,802         307,407         273,945         316,355

                Fines & Forfeitures                                  447,463           508,680         647,379         682,919         675,477

                Use of Money & Property                              407,071           375,513         213,378         114,896         110,076

                Revenue From Other Agencies                          240,007           301,455         480,821         381,872         426,198
                Citizen Services                                     618,768           642,072         702,343         734,845         752,691
                Recreation Services                                   49,418             48,283          57,289          54,828          57,316
                Sale of Goods                                           8,740            17,291          11,055          12,447          13,485
                Total Service Charges                                676,926           707,646         770,687         802,120         823,492
                Other Revenues                                        22,291             54,617          33,584          95,170          72,528

                TOTAL CURRENT REVENUES                            14,996,542        15,597,743      16,010,037      16,513,121      16,616,790

                Transfers                                            529,116           829,736         814,335         956,596       3,536,542

                TOTAL REVENUES & TRANSFERS                        15,525,658        16,427,479      16,824,372      17,469,716      20,153,332


                                                CITY OF BENBROOK 2018-19 ANNUAL BUDGET
                                                                              126