
Page 128 - Honorable Mayor and Members of the City Council
P. 128
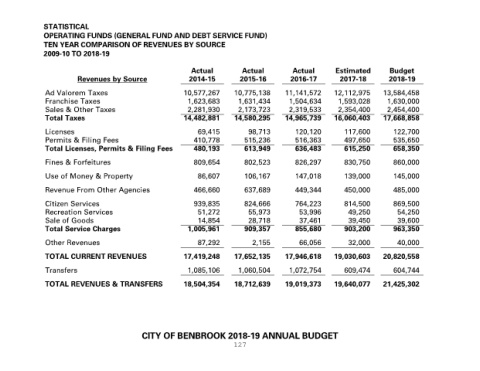
STATISTICAL
               OPERATING FUNDS (GENERAL FUND AND DEBT SERVICE FUND)
               TEN YEAR COMPARISON OF REVENUES BY SOURCE
               2009-10 TO 2018-19

                                                                Actual           Actual           Actual        Estimated         Budget
                           Revenues by Source                  2014-15          2015-16          2016-17         2017-18         2018-19

                Ad Valorem Taxes                              10,577,267      10,775,138       11,141,572      12,112,975      13,584,458
                Franchise Taxes                                1,623,683        1,631,434       1,504,634        1,593,028       1,630,000
                Sales & Other Taxes                            2,281,930        2,173,723       2,319,533        2,354,400       2,454,400
                Total Taxes                                   14,482,881   14,580,295          14,965,739   16,060,403         17,668,858

                Licenses                                          69,415           98,713         120,120          117,600         122,700
                Permits & Filing Fees                            410,778          515,236         516,363          497,650         535,650
                Total Licenses, Permits & Filing Fees            480,193          613,949         636,483          615,250         658,350
                Fines & Forfeitures                              809,654          802,523         826,297          830,750         860,000

                Use of Money & Property                           86,607          106,167         147,018          139,000         145,000

                Revenue From Other Agencies                      466,660          637,689         449,344          450,000         485,000

                Citizen Services                                 939,835          824,666         764,223          814,500         869,500
                Recreation Services                               51,272           55,973           53,996          49,250          54,250
                Sale of Goods                                     14,854           28,718           37,461          39,450          39,600
                Total Service Charges                          1,005,961          909,357         855,680          903,200         963,350

                Other Revenues                                    87,292            2,155           66,056          32,000          40,000

                TOTAL CURRENT REVENUES                        17,419,248      17,652,135       17,946,618      19,030,603      20,820,558

                Transfers                                      1,085,106        1,060,504       1,072,754          609,474         604,744

                TOTAL REVENUES & TRANSFERS                    18,504,354      18,712,639       19,019,373      19,640,077      21,425,302


                                                CITY OF BENBROOK 2018-19 ANNUAL BUDGET
                                                                              127