Page 268 - FY 19 Budget Forecast 91218.xlsx
P. 268

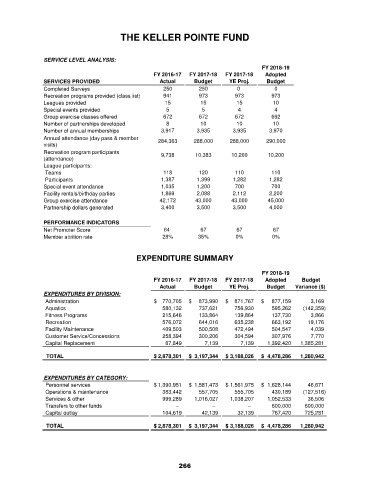
THE KELLER POINTE FUND


               SERVICE LEVEL ANALYSIS:
                                                                                        FY 2018-19
                                                    FY 2016-17   FY 2017-18   FY 2017-18   Adopted
               SERVICES PROVIDED                      Actual     Budget      YE Proj.    Budget
               Completed Surveys                       250         250         0            0
               Recreation programs provided (class list)  941      973         973         973
               Leagues provided                         15         15          15          10
               Special events provided                  5           5           4           4
               Group exercise classes offered          672         672         672         692
               Number of partnerships developed         8          10          10          10
               Number of annual memberships           3,917       3,935       3,935       3,970
               Annual attendance (day pass & member   284,363    288,000     288,000     290,000
               visits)
               Recreation program participants        9,738       10,383      10,200      10,200
               (attendance)
               League participants:
                Teams                                  118         120         110         110
                Participants                          1,387       1,399       1,282       1,282
               Special event attendance               1,035       1,200        700         700
               Facility rentals/birthday parties      1,869       2,088       2,112       2,200
               Group exercise attendance              42,172      43,000      43,000      45,000
               Partnership dollars generated          3,400       3,500       3,500       4,000

               PERFORMANCE INDICATORS
               Net Promoter Score                      64          67          67          67
               Member attrition rate                   28%         35%         0%          0%


                                              EXPENDITURE SUMMARY


                                                                                        FY 2018-19
                                                    FY 2016-17   FY 2017-18   FY 2017-18   Adopted    Budget
                                                      Actual     Budget      YE Proj.    Budget    Variance ($)
               EXPENDITURES BY DIVISION:
                Administration                      $      770,705  $       873,990  $      871,767  $       877,159             3,169
                Aquatics                                    580,132           737,621          756,930           595,262        (142,359)
                Fitness Programs                            215,646           133,864          139,864           137,730             3,866
                Recreation                                  576,072           644,016          635,238           663,192           19,176
                Facility Maintenance                        409,503           500,508          472,494           504,547             4,039
                Customer Service/Concessions                258,394           300,206          304,594           307,976             7,770
                Capital Replacement                           67,849               7,139              7,139        1,392,420      1,385,281

                TOTAL                               $  2,878,301  $   3,197,344  $  3,188,026  $    4,478,286    1,280,942


               EXPENDITURES BY CATEGORY:
                Personnel services                  $   1,390,951  $    1,581,473  $   1,561,975  $    1,628,144           46,671
                Operations & maintenance                    383,442           557,705          555,705           430,189        (127,516)
                Services & other                            999,289        1,016,027       1,038,207        1,052,533           36,506
                Transfers to other funds                             –                    –                   –           600,000         600,000
                Capital outlay                              104,619             42,139            32,139           767,420         725,281

                TOTAL                               $  2,878,301  $   3,197,344  $  3,188,026  $    4,478,286    1,280,942


                                                            266
   263   264   265   266   267   268   269   270   271   272   273