


Page 130 - CityofSouthlakeFY27Budget
P. 130
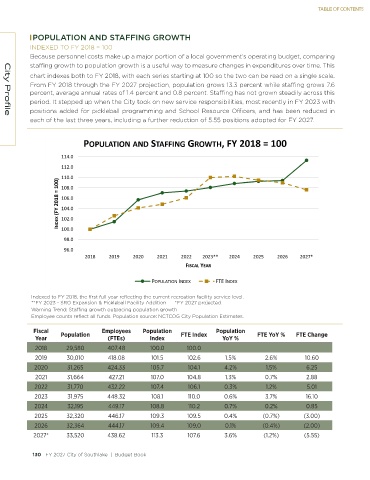
TABLE OF CONTENTS


            POPULATION AND STAFFING GROWTH
           INDEXED TO FY 2018 = 100
           Because personnel costs make up a major portion of a local government’s operating budget, comparing
           staffing growth to population growth is a useful way to measure changes in expenditures over time. This
           chart indexes both to FY 2018, with each series starting at 100 so the two can be read on a single scale.
           From FY 2018 through the FY 2027 projection, population grows 13.3 percent while staffing grows 7.6
           percent, average annual rates of 1.4 percent and 0.8 percent. Staffing has not grown steadily across this
           period. It stepped up when the City took on new service responsibilities, most recently in FY 2023 with
           positions added for pickleball programming and School Resource Officers, and has been reduced in
   City Profile
           each of the last three years, including a further reduction of 5.55 positions adopted for FY 2027.


           Indexed to FY 2018, the first full year reflecting the current recreation facility service level.
           **FY 2023 - SRO Expansion & Pickleball Facility Addition      *FY 2027 projected.
           Warning Trend: Staffing growth outpacing population growth
           Employee counts reflect all funds. Population source: NCTCOG City Population Estimates.

            Fiscal   Population    Employees    Population   FTE Index  Population    FTE YoY %    FTE Change
             Year                    (FTEs)        Index                   YoY %
             2018      29,580        407.48        100.0       100.0
             2019      30,010        418.08        101.5       102.6        1.5%         2.6%         10.60
            2020       31,265        424.33        105.7       104.1       4.2%          1.5%         6.25
             2021      31,664        427.21        107.0       104.8        1.3%         0.7%         2.88
            2022       31,770        432.22        107.4       106.1       0.3%          1.2%          5.01
            2023       31,975        448.32        108.1       110.0       0.6%          3.7%         16.10
            2024       32,195        449.17        108.8       110.2       0.7%          0.2%         0.85
            2025       32,320        446.17        109.3       109.5       0.4%         (0.7%)       (3.00)
            2026       32,364        444.17        109.4       109.0       0.1%         (0.4%)       (2.00)
            2027*      33,520        438.62        113.3       107.6       3.6%         (1.2%)        (5.55)


            130   FY 2027 City of Southlake  |  Budget Book                                                                                                                                           FY 2027 City of Southlake  |  Budget Book   131

