
Page 7 - CityofNorthRichlandHillsFY26AdoptedOperatingBudget
P. 7
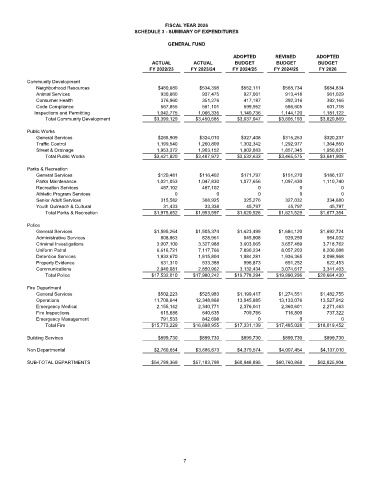
FISCAL YEAR 2026
                                              SCHEDULE 3 - SUMMARY OF EXPENDITURES
                                                         GENERAL FUND

                                                                              ADOPTED       REVISED       ADOPTED
                                                   ACTUAL        ACTUAL        BUDGET       BUDGET        BUDGET
                                                  FY 2022/23    FY 2023/24    FY 2024/25    FY 2024/25     FY 2026
          Community Development
             Neighborhood Resources                  $480,680      $534,398      $552,111      $568,734     $684,834
             Animal Services                          930,860       937,475       927,061      913,418       961,029
             Consumer Health                          376,960       351,276       417,187      392,316       392,166
             Code Compliance                          567,855       561,101       599,952      586,605       601,718
            Inspections and Permitting               1,042,775     1,066,335    1,140,736     1,144,120     1,181,122
                Total Community Development         $3,399,129    $3,450,585   $3,637,047    $3,605,193    $3,820,869
          Public Works
             General Services                        $268,909      $324,010      $327,408      $315,253     $320,237
             Traffic Control                         1,199,540     1,260,809    1,302,342     1,292,977     1,364,850
             Street & Drainage                       1,953,372     1,903,152    1,902,883     1,857,345     1,956,821
                Total Public Works                  $3,421,820    $3,487,972   $3,532,633    $3,465,575    $3,641,908
          Parks & Recreation
             General Services                        $120,481      $116,402      $171,797      $151,270     $186,137
             Parks Maintenance                       1,021,053     1,047,830    1,077,656     1,097,430     1,110,740
             Recreation Services                      487,102       487,102           0             0             0
             Athletic Program Services                     0             0            0             0             0
             Senior Adult Services                    315,582       308,925       325,276      327,032       334,680
             Youth Outreach & Cultural                 31,433        33,338        45,797       45,797        45,797
                Total Parks & Recreation            $1,975,652    $1,993,597   $1,620,526    $1,621,529    $1,677,354

          Police
             General Services                       $1,595,264    $1,505,374   $1,623,499    $1,684,120    $1,692,724
             Administrative Services                  808,863       828,961       945,908      929,250       984,032
             Criminal Investigations                 3,007,100     3,327,988    3,603,065     3,657,489     3,718,762
             Uniform Patrol                          6,616,721     7,117,766    7,890,234     8,057,203     8,206,088
             Detention Services                      1,932,670     1,815,804    1,984,281     1,936,365     2,098,968
             Property Evidence                        631,310       533,388       598,873      651,252       622,453
             Communications                          2,940,081     2,850,962    3,132,434     3,074,617     3,341,403
                Total Police                       $17,532,010   $17,980,242   $19,778,294  $19,990,296   $20,664,430

          Fire Department
             General Services                        $502,223      $525,983    $1,199,417    $1,274,551    $1,482,755
             Operations                             11,708,644    12,348,868    13,045,885   13,133,076    13,527,912
             Emergency Medical                       2,155,142     2,340,771    2,376,041     2,360,601     2,271,463
             Fire Inspections                         615,686       640,635       709,796      716,800       737,322
             Emergency Management                     791,533       842,698           0             0             0
                Total Fire                         $15,773,229   $16,698,955   $17,331,139  $17,485,028   $18,019,452

          Building Services                          $899,730      $899,730      $899,730      $899,730     $899,730

          Non Departmental                          $2,760,654    $3,686,673    $4,379,574   $4,007,454    $4,137,010
          SUB-TOTAL DEPARTMENTS                    $54,789,369   $57,183,798   $60,848,895  $60,760,868   $62,825,904


                                                              7