
Page 12 - Proposed budget cover and insert sheets
P. 12
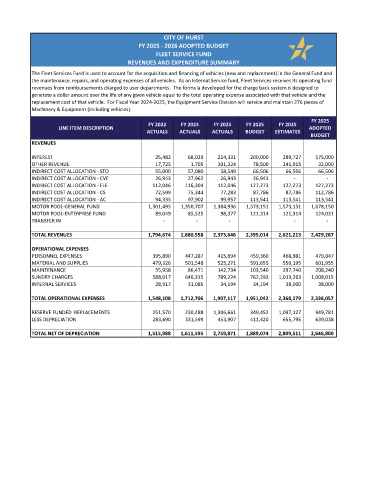
CITY OF HURST
                                               FY 2025 - 2026 ADOPTED BUDGET
                                                     FLEET SERVICE FUND
                                           REVENUES AND EXPENDITURE SUMMARY
            The Fleet Services Fund is used to account for the acquisition and financing of vehicles (new and replacement) in the General Fund and
            the maintenance, repairs, and operating expenses of all vehicles.  As an Internal Service fund, Fleet Services receives its operating fund
            revenues from reimbursements charged to user departments.  The formula developed for the charge back system is designed to
            generate a dollar amount over the life of any given vehicle equal to the total operating expense associated with that vehicle and the
            replacement cost of that vehicle.  For Fiscal Year 2024-2025, the Equipment Service Division will service and maintain 276 pieces of
            Machinery & Equipment (including vehicles).
                                                                                                        FY 2025
                                                  FY 2022    FY 2023    FY 2024   FY 2025    FY 2025
                    LINE ITEM DESCRIPTION                                                              ADOPTED
                                                  ACTUALS   ACTUALS    ACTUALS    BUDGET    ESTIMATES
                                                                                                        BUDGET
            REVENUES

            INTEREST                                        25,482            68,029          214,331          200,000          289,727          175,000
            OTHER REVENUE                                   17,725              1,705          301,224            78,500          241,915            32,000
            INDIRECT COST ALLOCATION - STO                  55,000            57,080            58,549            66,506            66,506            66,506
            INDIRECT COST ALLOCATION - CVF                  26,943            27,962            26,943            26,943                   -                    -
            INDIRECT COST ALLOCATION - FLE                112,046          116,304          112,046          127,273          127,273          127,273
            INDIRECT COST ALLOCATION - CS                   72,599            75,344            77,283            87,786            87,786          112,786
            INDIRECT COST ALLOCATION - AC                   94,335            97,902            99,957          113,541          113,541          113,541
            MOTOR POOL-GENERAL FUND                   1,301,495      1,350,707      1,384,936      1,573,151      1,573,151      1,678,150
            MOTOR POOL-ENTERPRISE FUND                      89,049            85,525            98,377          121,314          121,314          124,031
            TRANSFER IN                                            -                    -                    -                    -                    -

            TOTAL REVENUES                            1,794,674       1,880,558       2,373,646       2,395,014       2,621,213       2,429,287

            OPERATIONAL EXPENSES
            PERSONNEL EXPENSES                            395,890          447,287          415,694          459,360          468,981          479,847
            MATERIAL AND SUPPLIES                         479,326          501,548          525,271          591,655          550,195          601,955
            MAINTENANCE                                     55,958            86,471          142,734          103,540          297,740          208,240
            SUNDRY CHARGES                                588,017          646,315          789,224          762,293      1,013,263      1,008,015
            INTERNAL SERVICES                               28,917            31,085            34,194            34,194            38,000            38,000

            TOTAL OPERATIONAL EXPENSES                1,548,108       1,712,706       1,907,117       1,951,042       2,368,179       2,336,057

            RESERVE FUNDED  REPLACEMENTS                  251,570          230,488      1,306,661          349,452      1,097,127          949,781
            LESS DEPRECIATION                             283,690          331,599          453,907          411,420          655,795          639,038

            TOTAL NET OF DEPRECIATION                 1,515,988       1,611,595       2,759,871       1,889,074       2,809,511       2,646,800