
Page 48 - BudgetBookCover_FY26_Adopted.pdf
P. 48
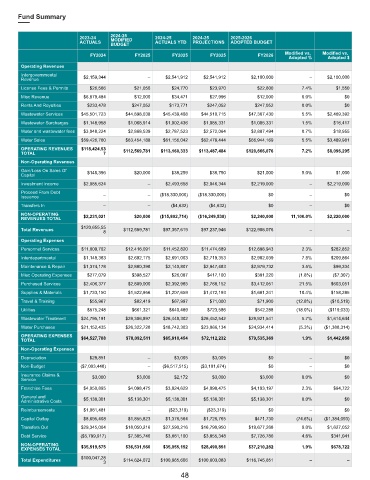
Fund Summary


                           2023-24    2024-25       2024-25      2024-25     2025-2026
                                      MODIFIED
                           ACTUALS                  ACTUALS YTD  PROJECTIONS  ADOPTED BUDGET
                                      BUDGET
                                                                                               Modified vs.   Modified vs.
                               FY2024         FY2025      FY2025       FY2025         FY2026
                                                                                                 Adopted %   Adopted $
        Operating Revenues
        Intergovernmental
        Revenue              $2,159,344           –     $2,541,912  $2,541,912      $2,100,000         –     $2,100,000
        License Fees & Permits  $26,566      $21,050      $24,770     $23,970         $22,600        7.4%       $1,550
        Misc Revenue         $6,879,484      $12,000      $34,471     $27,996         $12,000        0.0%          $0
        Rents And Royalties   $233,478       $247,052    $173,771     $247,052       $247,052        0.0%          $0
        Wastewater Services  $45,501,723   $44,898,038  $45,439,408  $44,510,715   $47,367,430       5.5%    $2,469,392
        Wastewater Surcharges  $1,148,958  $1,068,914   $1,002,436  $1,085,331      $1,085,331       1.5%      $16,417
        Water and wastewater fees  $3,048,224  $2,868,539  $2,787,523  $2,572,064   $2,887,494       0.7%      $18,955
        Water Sales         $59,426,760    $63,454,188  $61,156,042  $62,478,444   $66,944,169       5.5%    $3,489,981
        OPERATING REVENUES   $118,424,53  $112,569,781  $113,160,333  $113,487,484  $120,666,076     7.2%    $8,096,295
        TOTAL                      7
        Non-Operating Revenues
        Gain/Loss On Sales Of   $145,396     $20,000      $38,259     $38,750         $21,000        5.0%       $1,000
        Capital
        Investment Income    $2,085,624           –     $2,493,658  $2,046,344      $2,219,000         –     $2,219,000
        Proceed From Debt
        Issuance                   –              –   ($18,330,000)  ($18,330,000)        $0           –           $0
        Transfers In               –              –       ($4,632)    ($4,632)            $0           –           $0
        NON-OPERATING
        REVENUES TOTAL       $2,231,021      $20,000  ($15,802,714)  ($16,249,538)  $2,240,000   11,100.0%   $2,220,000
                            $120,655,55
        Total Revenues                    $112,589,781  $97,357,619  $97,237,946  $122,906,076         –            –
                                   8
        Operating Expenses
        Personnel Services  $11,009,702    $12,416,091  $11,452,820  $11,474,689   $12,698,943       2.3%      $282,852
        Interdepartmental    $1,148,383    $2,692,175   $2,691,003  $2,719,353      $2,902,039       7.8%      $209,864
        Maintenance & Repair  $1,374,178   $2,880,398   $2,140,807  $2,947,483      $2,979,732       3.5%      $99,334
        Misc Operating Expenses  $277,079    $398,527     $26,087     $417,100       $391,220       (1.8%)     ($7,307)
        Purchased Services   $2,406,377    $2,809,000   $2,392,985  $2,768,152      $3,412,051      21.5%      $603,051
        Supplies & Materials  $1,733,150   $1,522,956   $1,207,659  $1,472,193      $1,681,241      10.4%      $158,285
        Travel & Training      $55,967       $82,419      $67,997     $71,000         $71,900      (12.8%)    ($10,519)
        Utilities             $575,248       $661,321    $640,489     $723,586       $542,288      (18.0%)    ($119,033)
        Wastewater Treatment  $24,795,191  $28,306,897  $26,448,302  $26,452,542   $29,921,541       5.7%    $1,614,644
        Water Purchases     $21,152,435    $26,322,728  $18,742,303  $23,066,134   $24,934,414      (5.3%)  ($1,388,314)
        OPERATING EXPENSES   $64,527,708   $78,092,511  $65,810,454  $72,112,232   $79,535,369       1.9%    $1,442,858
        TOTAL
        Non-Operating Expenses
        Depreciation           $28,851            –        $3,005      $3,005             $0           –           $0
        Non-Budget          ($7,003,448)          –    ($6,517,515)  ($3,101,674)         $0           –           $0
        Insurance Claims &      $3,000        $3,000       $2,172      $3,000          $3,000        0.0%          $0
        Service
        Franchise Fees       $4,050,895    $4,098,475   $3,824,629  $4,098,475      $4,193,197       2.3%      $94,722
        General and          $5,138,301    $5,138,301   $5,138,301  $5,138,301      $5,138,301       0.0%          $0
        Administrative Costs
        Reimbursements       $1,061,481           –      ($23,319)   ($23,319)            $0           –           $0
        Capital Outlay       $8,695,408    $1,855,823   $1,376,564  $1,726,765       $471,730      (74.6%)  ($1,384,093)
        Transfers Out       $29,345,004    $18,050,216  $27,590,216  $16,790,950   $19,677,268       9.0%    $1,627,052
        Debt Service        ($5,799,917)   $7,385,746   $3,661,100  $3,855,348      $7,726,786       4.6%      $341,041
        NON-OPERATING
        EXPENSES TOTAL      $35,519,575    $36,531,560  $35,055,152  $28,490,851   $37,210,282       1.9%      $678,722
                            $100,047,28
        Total Expenditures         3      $114,624,072  $100,865,606  $100,603,083  $116,745,651       –            –
                                                             48