
Page 43 - BudgetBookCover_FY26_Adopted.pdf
P. 43
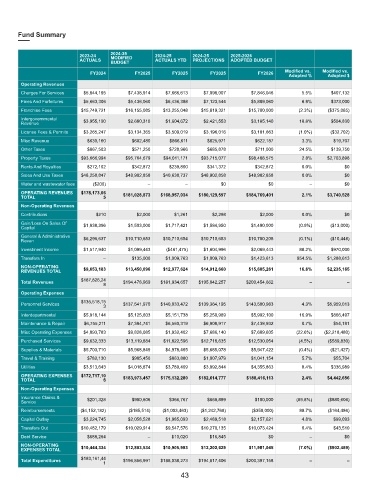
Fund Summary


                                      2024-25
                           2023-24    MODIFIED      2024-25      2024-25     2025-2026
                           ACTUALS    BUDGET        ACTUALS YTD  PROJECTIONS  ADOPTED BUDGET
                                                                                               Modified vs.   Modified vs.
                               FY2024         FY2025      FY2025       FY2025         FY2026
                                                                                                 Adopted %   Adopted $
        Operating Revenues
        Charges For Services  $5,844,195   $7,438,914   $7,666,613  $7,098,007      $7,846,046       5.5%      $407,132
        Fines And Forfeitures  $5,663,306  $5,436,060   $6,436,398  $7,123,544      $5,809,060       6.9%      $373,000
        Franchise Fees      $15,749,721    $16,155,085  $13,255,048  $15,819,321   $15,780,000      (2.3%)    ($375,085)
        Intergovernmental    $3,955,190    $2,680,310   $1,604,672  $2,421,553      $3,185,140      18.8%      $504,830
        Revenue
        License Fees & Permits  $3,265,247  $3,134,365  $3,509,019  $3,196,016      $3,101,663      (1.0%)    ($32,702)
        Misc Revenue          $630,160       $602,480    $866,611     $825,971       $622,187        3.3%      $19,707
        Other Taxes           $867,503       $571,250    $728,966     $685,878       $711,000       24.5%      $139,750
        Property Taxes      $93,666,994    $95,764,679  $94,011,171  $93,715,077   $98,468,575       2.8%    $2,703,896
        Rents And Royalties   $272,102       $342,872    $239,800     $341,372       $342,872        0.0%          $0
        Sales And Use Taxes  $48,258,847   $48,902,858  $40,638,737  $48,902,858   $48,902,858       0.0%          $0
        Water and wastewater fees  ($200)         –           –           $0              $0           –           $0
        OPERATING REVENUES   $178,173,06  $181,028,873  $168,957,034  $180,129,597  $184,769,401     2.1%    $3,740,528
        TOTAL                      5
        Non-Operating Revenues
        Contributions            $210         $2,000       $1,261      $2,298          $2,000        0.0%          $0
        Gain/Loss On Sales Of   $1,838,396  $1,503,000  $1,717,421  $1,584,950      $1,490,000      (0.9%)    ($13,000)
        Capital
        General & Administrative   $6,296,637  $10,710,653  $10,710,654  $10,710,653  $10,700,205   (0.1%)    ($10,448)
        Reven
        Investment Income    $1,517,940    $1,099,443   ($461,475)  $1,604,996      $2,069,443      88.2%      $970,000
        Transfers In               –         $135,000   $1,009,763  $1,009,763      $1,423,613     954.5%    $1,288,613
        NON-OPERATING
        REVENUES TOTAL       $9,653,183    $13,450,096  $12,977,624  $14,912,660   $15,685,261      16.6%    $2,235,165

        Total Revenues      $187,826,24   $194,478,969  $181,934,657  $195,042,257  $200,454,662       –            –
                                   8
        Operating Expenses
                            $135,518,15
        Personnel Services                $137,541,970  $140,033,472  $139,364,195  $143,500,983     4.3%    $5,959,013
                                   3
        Interdepartmental    $5,918,144    $5,125,603   $5,151,738  $5,250,989      $5,992,100      16.9%      $866,497
        Maintenance & Repair  $6,755,211   $7,384,741   $6,560,319  $6,908,917      $7,438,932       0.7%      $54,191
        Misc Operating Expenses  $4,893,783  $9,828,085  $1,932,402  $7,686,140     $7,609,605     (22.6%)  ($2,218,480)
        Purchased Services   $9,632,333    $13,119,884  $11,822,596  $12,718,635   $12,530,054      (4.5%)    ($589,830)
        Supplies & Materials  $5,703,710   $5,968,849   $4,978,465  $5,685,078      $5,947,422      (0.4%)    ($21,427)
        Travel & Training     $782,130       $985,450    $863,880   $1,007,979      $1,041,154       5.7%      $55,704
        Utilities            $3,513,643    $4,018,874   $3,789,409  $3,992,844      $4,355,863       8.4%      $336,989
        OPERATING EXPENSES   $172,717,10  $183,973,457  $175,132,280  $182,614,777  $188,416,113     2.4%    $4,442,656
        TOTAL                      6
        Non-Operating Expenses
        Insurance Claims &    $201,328       $980,606    $366,767     $668,899       $100,000      (89.8%)    ($880,606)
        Service
        Reimbursements      ($4,152,182)    ($185,514)  ($1,003,463)  ($1,242,768)  ($350,000)      88.7%     ($164,486)
        Capital Outlay       $3,224,745    $2,058,528   $1,985,093  $2,489,518      $2,157,621       4.8%      $99,093
        Transfers Out       $10,482,179    $10,029,914  $9,547,576  $10,270,135    $10,073,424       0.4%      $43,510
        Debt Service          $688,264            –       $10,020     $16,845             $0           –           $0
        NON-OPERATING       $10,444,334    $12,883,534  $10,905,993  $12,202,629   $11,981,045      (7.0%)    ($902,489)
        EXPENSES TOTAL
                            $183,161,44
        Total Expenditures         1      $196,856,991  $186,038,273  $194,817,406  $200,397,158       –            –
                                                             43