
Page 125 - BudgetBookCover_FY26_Adopted.pdf
P. 125
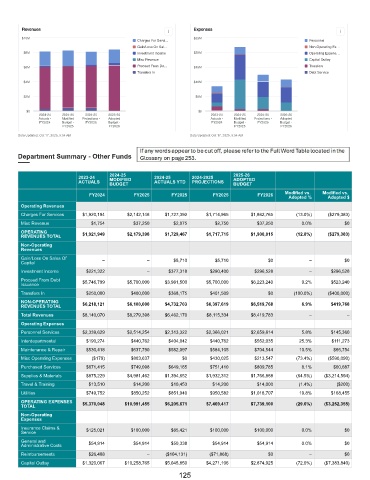
Revenues                                                 Expenses
        $10M                                                     $25M
                                              Charges For Servi…                                       Personnel
                                              Gain/Loss On Sal…                                        Non-Operating Ex…
         $8M                                  Investment Income  $20M                                  Operating Expens…
                                              Misc Revenue                                             Capital Outlay
         $6M                                  Proceed From De…   $15M                                  Transfers
                                              Transfers In                                             Debt Service
         $4M                                                     $10M

         $2M                                                      $5M

          $0                                                       $0
              2023-24  2024-25  2024-25  2025-26                       2023-24  2024-25  2024-25  2025-26
                Actuals -    Modified    Projections -    Adopted        Actuals -    Modified    Projections -    Adopted
                FY2024    Budget -    FY2025    Budget -                 FY2024    Budget -    FY2025    Budget -
                        FY2025         FY2026                                    FY2025         FY2026
       Data Updated: Oct 17, 2025, 5:54 AM                      Data Updated: Oct 17, 2025, 5:54 AM


       Department Summary - Other Funds


                                     2024-25                                  2025-26
                           2023-24   MODIFIED       2024-25      2024-2025    ADOPTED
                           ACTUALS   BUDGET         ACTUALS YTD  PROJECTIONS  BUDGET
                               FY2024        FY2025       FY2025       FY2025         FY2026   Modified vs.   Modified vs.
                                                                                                Adopted %    Adopted $
        Operating Revenues
        Charges For Services  $1,920,194   $2,142,148   $1,727,392   $1,714,965     $1,862,765     (13.0%)    ($279,383)
        Misc Revenue           $1,754        $37,250      $2,075        $2,750        $37,250        0.0%          $0
        OPERATING
        REVENUES TOTAL      $1,921,949     $2,179,398   $1,729,467   $1,717,715     $1,900,015     (12.8%)    ($279,383)
        Non-Operating
        Revenues
        Gain/Loss On Sales Of      –              –       $5,710        $5,710            $0           –           $0
        Capital
        Investment Income     $221,322            –      $377,318     $290,400       $296,528          –       $296,528
        Proceed From Debt   $5,746,799     $5,700,000   $3,981,500   $5,700,000     $6,223,240       9.2%      $523,240
        Issuance
        Transfers In          $250,000      $400,000     $368,175     $401,509            $0      (100.0%)    ($400,000)
        NON-OPERATING       $6,218,121     $6,100,000   $4,732,703   $6,397,619     $6,519,768       6.9%      $419,768
        REVENUES TOTAL
        Total Revenues      $8,140,070     $8,279,398   $6,462,170   $8,115,334     $8,419,783         –            –
        Operating Expenses
        Personnel Services  $2,339,629     $2,514,254   $2,313,322   $2,366,021     $2,659,614       5.8%      $145,360
        Interdepartmental     $190,274      $440,762     $404,042     $440,762       $552,035       25.3%      $111,273
        Maintenance & Repair  $530,418      $637,790     $582,097     $584,105       $704,544       10.5%      $66,754
        Misc Operating Expenses  ($179)     $803,637         $0       $430,025       $213,547      (73.4%)    ($590,090)
        Purchased Services    $671,415      $749,098     $649,165     $751,410       $809,785        8.1%      $60,687
        Supplies & Materials  $875,229     $4,981,462   $1,394,652   $1,932,312     $1,766,868     (64.5%)  ($3,214,594)
        Travel & Training     $13,510        $14,200      $10,453      $14,200        $14,000       (1.4%)      ($200)
        Utilities             $749,752      $850,252     $851,940     $950,582      $1,018,707      19.8%      $168,455
        OPERATING EXPENSES   $5,370,048   $10,991,455   $6,205,671   $7,469,417     $7,739,100     (29.6%)  ($3,252,355)
        TOTAL
        Non-Operating
        Expenses
        Insurance Claims &    $125,021      $100,000      $85,421     $100,000       $100,000        0.0%          $0
        Service
        General and           $54,914        $54,914      $50,338      $54,914        $54,914        0.0%          $0
        Administrative Costs
        Reimbursements        $26,408             –     ($104,131)    ($71,868)           $0           –           $0
        Capital Outlay      $1,320,067    $10,258,765   $5,045,850   $4,271,106     $2,874,925     (72.0%)  ($7,383,840)
                                                            125