
Page 139 - CityofEulessFY26AdoptedBudgetOrdinance2432
P. 139
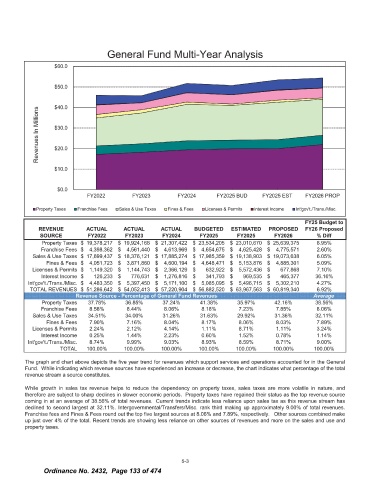
General Fund Multi -Year Analysis

                    60. 0


                    50. 0


                    40. 0
            Millions

                    30. 0
            In

            Revenues  20. 0


                    10. 0


                     0. 0
                              FY2022         FY2023         FY2024       FY2025 BUD     FY2025 EST    FY2026 PROP

             Property Taxes    Franchise Fees  Sales &  Use Taxes   Fines &  Fees   Licenses &  Permits   Interest Income  Int' gov' t./ Trans./ Misc.

                                                                                                      FY25 Budget to
              REVENUE         ACTUAL      ACTUAL      ACTUAL     BUDGETED    ESTIMATED    PROPOSED    FY26 Proposed
              SOURCE          FY2022      FY2023       FY2024      FY2025      FY2025       FY2026          Diff
               Property Taxes $   19, 378, 217 $   19, 924, 168 $   21, 307, 422 $   23, 534, 205 $   23, 010, 670 $   25, 639, 375  8. 95%
               Franchise Fees $   4, 398, 362 $   4, 561, 440 $   4, 613, 969 $   4, 654, 675 $   4, 625, 428 $   4, 775, 571  2. 60%
            Sales &  Use Taxes $   17, 699,437 $   18, 376, 121 $   17, 885, 274 $   17, 985,359 $   19, 138, 903 $   19, 073, 638  6. 05%
                Fines &  Fees $   4, 051, 723 $   3, 871, 860 $   4, 600, 194 $   4, 648, 471 $   5, 153, 876 $   4, 885, 301  5. 09%
            Licenses &  Permits $   1, 149, 320 $   1, 144, 743 $   2, 366, 129 $   632, 922 $   5, 572, 436 $   677, 868  7. 10%
               Interest Income $   126, 233 $   776, 631 $   1, 276, 816 $   341, 793 $   969, 535 $   465, 377  36. 16%
          Int' gov' t./ Trans./ Misc. $   4, 483, 350 $   5, 397, 450 $   5, 171, 100 $   5, 085, 095 $   5, 496, 715 $   5, 302, 210  4. 27%
           TOTAL REVENUES $   51, 286, 642 $   54, 052, 413 $   57, 220, 904 $   56, 882, 520 $   63, 967, 563 $   60, 819, 340  6. 92%
               Property Taxes  37. 78%    36. 85%      37. 24%     41. 38%      35. 97%     42. 16%      38. 56%
               Franchise Fees  8. 58%      8. 44%      8. 06%       8. 18%      7. 23%      7. 85%        8. 06%
            Sales &  Use Taxes  34. 51%   34. 00%      31. 26%     31. 63%     29. 92%      31. 36%      32. 11%
                Fines &  Fees  7. 90%      7. 16%      8. 04%       8. 17%      8. 06%      8. 03%        7. 89%
            Licenses &  Permits  2. 24%    2. 12%      4. 14%       1. 11 %     8. 71%      1. 11%        3. 24%
               Interest Income  0. 25%     1. 44%      2. 23%       0. 60%      1. 52%      0. 78%        1. 14%
          I nt' gov' t./ Trans./ M isc.   8. 74%   9. 99%   9. 03%   8. 93%     8. 59%      8. 71         9. 00%
                     TOTAL    100. 00%    100. 00%    100. 00%     100. 00%    100. 00%    100. 00%      100. 00%
         The graph and chart above depicts the five year trend for revenues which support services and operations accounted for in the General
         Fund.  While indicating  which revenue sources have experienced  an increase or decrease,  the chart indicates what percentage  of the total
         revenue  stream  a source  constitutes.

         While growth in sales tax revenue helps to reduce the dependency on property taxes,  sales taxes are more volatile in nature,  and
         therefore are subject to sharp declines in slower economic periods.  Property taxes have regained their status as the top revenue source
         coming  in at an average  of 38. 56%  of total revenues.  Current trends indicate less reliance upon sales tax as this revenue stream has
         declined to second largest at 32. 11%.   Intergovernmental/  Transfers/ Misc.  rank third making  up approximately  9. 00%  of total revenues.
         Franchise fees and Fines &  Fees round out the top five largest sources at 8. 06%  and 7. 89%,  respectively.   Other sources combined  make
         up just over 4%  of the total.  Recent trends are showing  less reliance on other sources  of revenues  and more on the sales and use and
         property taxes.


                                                             5- 3
                Ordinance No.  2432,  Page 133 of 474