
Page 66 - ClearGov | Documents
P. 66
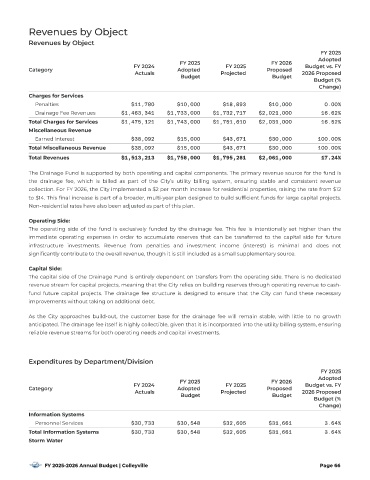
Revenues by Object
           Revenues by Object
                                                                                                           FY 2025
                                                                                                          Adopted
                                                             FY 2025                       FY 2026
                                             FY 2024                        FY 2025                   Budget vs. FY
           Category                                         Adopted                      Proposed
                                              Actuals                     Projected                  2026 Proposed
                                                             Budget                        Budget
                                                                                                         Budget (%
                                                                                                           Change)
           Charges for Ser vices
             Penalties                      $11,780         $10,000        $18,893        $10,000           0.00%
             Drainage Fee Revenues       $1,463,341     $1,733,000     $1,732,717      $2,021,000          16.62%
           Total Charges for Ser vices   $1,475,121     $1,743,000     $1,751,610      $2,031,000          16.52%
           Miscellaneous Revenue
             Earned Interest                $38,092         $15,000        $43,671        $30,000         100.00%
           Total Miscellaneous Revenue      $38,092         $15,000        $43,671        $30,000         100.00%
           Total Revenues                $1,513,213     $1,758,000     $1,795,281      $2,061,000          17.24%

           The  Drainage   Fund  is   suppor ted   by   both  operating   and   capital   components.   The   primary   revenue   source  for   the   fund   is
           the   drainage   fee,   which   is   billed   as   par t   of   the   City ’s   utility   billing   system,   ensuring   stable   and   consistent   revenue
           collection.  For   FY  2026 ,  the  City   implemented   a   $2  per  month   increase   for  residential  proper ties,  raising  the  rate  from  $12
           to   $14 .   This   {nal   increase   is   par t  of  a  broader,  multi-year   plan  designed   to  build   suf{cient   funds   for   large  capital   projects.
           Non-residential rates have also been adjusted as par t of this plan.

           Operating Side:
           The   operating   side   of   the   fund   is   exclusively   funded   by   the   drainage   fee.   This   fee   is   intentionally   set   higher   than   the
           immediate   operating   expenses   in   order   to   accumulate   reser ves   that   can   be   transferred   to   the   capital   side   for   future
           infrastructure   investments.   Revenue   from   penalties   and   investment   income   (interest)   is   minimal   and   does   not
           signi{cantly contribute to the overall revenue, though it is still included as a small supplementary source.

           Capital Side:
           The  capital   side   of  the   Drainage   Fund   is   entirely   dependent   on   transfers   from   the   operating   side.   There   is   no   dedicated
           revenue   stream  for  capital  projects,   meaning   that  the   City   relies  on  building  reser ves   through  operating  revenue  to   cash-
           fund   future   capital   projects.   The   drainage   fee   structure   is   designed   to   ensure   that   the   City   can   fund   these   necessary
           improvements without taking on additional debt .


           As   the   City   approaches   build- out ,   the   customer   base   for   the   drainage   fee   will   remain   stable,   with   little   to   no   growth
           anticipated.  The  drainage  fee  itself  is  highly  collectible,  given  that  it  is  incorporated  into  the  utility  billing  system,  ensuring
           reliable revenue streams for both operating needs and capital investments.


           Expenditures by Depar tment/Division
                                                                                                           FY 2025
                                                                                                          Adopted
                                                             FY 2025                       FY 2026
                                             FY 2024                        FY 2025                   Budget vs. FY
           Category                                         Adopted                      Proposed
                                              Actuals                     Projected                  2026 Proposed
                                                             Budget                        Budget
                                                                                                         Budget (%
                                                                                                           Change)
           Information Systems
             Personnel Ser vices            $30,733         $30,548        $32,605        $31,661           3.64%
           Total Information Systems        $30,733         $30,548        $32,605        $31,661           3.64%
           Storm Water


                FY 2025-2026 Annual Budget | Colleyville                                                   Page 66