
Page 60 - ClearGov | Documents
P. 60
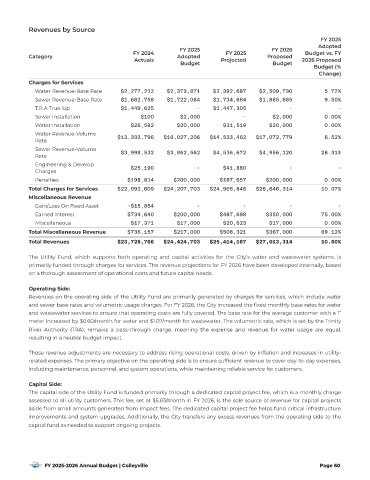
Revenues by Source
                                                                                                           FY 2025
                                                                                                          Adopted
                                                            FY 2025                        FY 2026
                                             FY 2024                        FY 2025                   Budget vs. FY
           Category                                         Adopted                      Proposed
                                             Actuals                      Projected                  2026 Proposed
                                                             Budget                        Budget
                                                                                                         Budget (%
                                                                                                           Change)
           Charges for Ser vices
             Water Revenue -Base Rate    $2,277,212     $2,373,871      $2,392,687     $2,509,730           5.72%
             Sewer Revenue -Base Rate    $1,682,758     $1,722,064      $1,734,664     $1,885,685           9.50%
             T.R. A True -Up             $1,449,625               -     $1,447,305               -               -
             Sewer Installation                 $100         $2,000              -         $2,000           0.00%
             Water Installation             $26,582         $20,000        $31,519        $20,000           0.00%
             Water Revenue -Volume
                                        $13,333,796    $16,027,206    $14,533,462     $17,072,779           6.52%
             Rate
             Sewer Revenue -Volume
                                         $3,998,532     $3,862,562      $4,536,672     $4,956,120          28.31%
             Rate
             Engineering & Develop
                                            $25,190               -        $41,880               -               -
             Charges
             Penalties                     $198,814       $200,000        $187,657       $200,000           0.00%
           Total Charges for Ser vices  $22,992,609    $24,207,703    $24,905,846     $26,646,314          10.07%
           Miscellaneous Revenue
             Gain/Loss On Fixed Asset      -$15,854               -              -               -               -
             Earned Interest               $734,640       $200,000        $487,698       $350,000          75.00%
             Miscellaneous                  $17,371         $17,000        $20,623        $17,000           0.00%
           Total Miscellaneous Revenue     $736,157       $217,000        $508,321       $367,000          69.12%
           Total Revenues               $23,728,766    $24,424,703    $25,414,167     $27,013,314          10.60%

           The   Utility   Fund,   which   suppor ts   both   operating   and   capital   activities   for   the   City ’s   water   and   wastewater   systems,   is
           primarily  funded  through  charges  for  ser vices.  The  revenue  projections  for  FY  2026  have  been  developed  internally,  based
           on a thorough assessment of operational costs and future capital needs.

           Operating Side:
           Revenues   on   the  operating   side   of  the   Utility  Fund   are   primarily   generated   by   charges   for   ser vices,   which   include   water
           and  sewer  base  rates  and  volumetric  usage  charges.  For  FY  2026 ,  the  City  increased  the  {xed  monthly  base  rates  for  water
           and  wastewater  ser vices  to  ensure  that  operating  costs  are  fully  covered.  The  base  rate  for  the  average  customer  with  a  1”
           meter  increased  by  $0.60/month  for  water  and  $1.07/month  for  wastewater.  The  volumetric  rate,  which  is  set  by  the  Trinity
           River   Authority   (TRA),   remains   a   pass- through   charge,   meaning   the   expense   and   revenue   for   water   usage   are   equal,
           resulting in a neutral budget impact .

           These   revenue   adjustments   are   necessary   to   address   rising   operational   costs,   driven   by   in|ation   and   increases   in   utility-
           related  expenses.  The  primary  objective  on  the  operating  side  is  to  ensure  suf{cient  revenue  to  cover  day- to - day  expenses,
           including maintenance, personnel, and system operations, while maintaining reliable ser vice for customers.


           Capital Side:
           The  capital  side  of  the  Utility  Fund  is  funded  primarily  through  a  dedicated  capital  project  fee,  which  is  a  monthly  charge
           assessed   to   all   utility   customers.   This   fee,   set  at   $5. 83/month   in   FY   2026 ,   is   the  sole   source  of  revenue   for   capital  projects
           aside  from  small  amounts  generated  from  impact  fees.  The  dedicated  capital  project  fee  helps  fund  critical  infrastructure
           improvements   and   system   upgrades.   Additionally,   the  City  transfers   any   excess   revenues   from   the   operating   side   to   the
           capital fund as needed to suppor t ongoing projects.


                FY 2025-2026 Annual Budget | Colleyville                                                   Page 60