
Page 367 - Bedford-FY25-26 Budget
P. 367
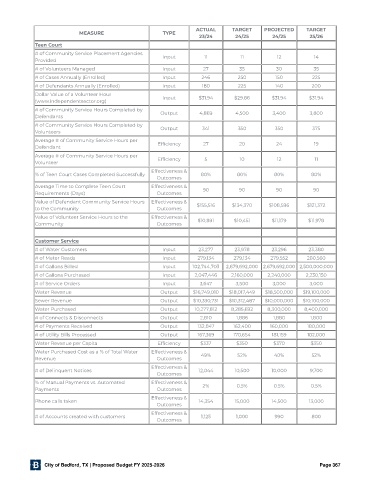
ACTUAL      TARGET    PROJECTED     TARGET
                           MEASURE                     TYPE
                                                                   23/24       24/25       24/25       25/26

             Teen Court
             # of Community Service Placement Agencies  Input        11          11          12          14
             Provided
             # of Volunteers Managed                   Input        27          35          30           35
             # of Cases Annually (Enrolled)            Input        246         250         150         225
             # of Defendants Annually (Enrolled)       Input        180         225         140         200
             Dollar Value of a Volunteer Hour          Input       $31.94      $29.86      $31.94      $31.94
             (www.independentsector.org)
             # of Community Service Hours Completed by
             Defendants                               Output       4,869       4,500       3,400       3,800
             # of Community Service Hours Completed by  Output      341         350         350         375
             Volunteers
             Average # of Community Service Hours per  Ef ciency    27          20          24           19
             Defendant
             Average # of Community Service Hours per
             Volunteer                               Ef ciency       5          10           12          11
                                                   Effectiveness &
             % of Teen Court Cases Completed Successfully          80%         80%          80%         80%
                                                     Outcomes
             Average Time to Complete Teen Court   Effectiveness &  90          90          90           90
             Requirements (Days)                     Outcomes
             Value of Defendant Community Service Hours  Effectiveness &
             to the Community                        Outcomes     $155,516    $134,370    $108,596     $121,372
             Value of Volunteer Service Hours to the  Effectiveness &  $10,891  $10,451    $11,179     $11,978
             Community                               Outcomes


             Customer Service
             # of Water Customers                      Input       23,277      23,978      23,296      23,380
             # of Meter Reads                          Input      279,134     279,134     279,552      280,560
             # of Gallons Billed                       Input     102,744,703  2,679,692,000  2,679,692,000 2,500,000,000
             # of Gallons Purchased                    Input     2,047,446    2,160,000   2,240,000   2,230,150
             # of Service Orders                       Input       3,647       3,500       3,000       3,000
             Water Revenue                            Output     $16,749,010  $18,017,449  $18,500,000  $19,100,000
             Sewer Revenue                            Output     $10,330,731  $10,312,487  $10,000,000  $10,100,000
             Water Purchased                          Output     10,277,812  8,285,692   8,300,000    8,400,000
             # of Connects & Disconnects              Output       2,810       1,886       1,880        1,800
             # of Payments Received                   Output      132,847     162,400     160,000      180,000
             # of Utility Bills Processed             Output      167,369     170,654      181,159     182,000
             Water Revenue per Capita                Ef ciency     $337        $350        $370         $350
             Water Purchased Cost as a % of Total Water  Effectiveness &  49%   52%         40%         52%
             Revenue                                 Outcomes
                                                   Effectiveness &
             # of Delinquent Notices                               12,044      10,500      10,000       9,700
                                                     Outcomes
             % of Manual Payments vs. Automated    Effectiveness &
             Payments                                Outcomes       2%         0.5%         0.5%        0.5%
                                                   Effectiveness &
             Phone calls taken                                     14,354      15,000      14,500      13,000
                                                     Outcomes
                                                   Effectiveness &
             # of Accounts created with customers                   1,125      1,000        990         800
                                                     Outcomes


                City of Bedford, TX | Proposed Budget FY 2025-2026                                         Page 367