
Page 35 - CityofArlingtonFY26AdoptedBudget
P. 35
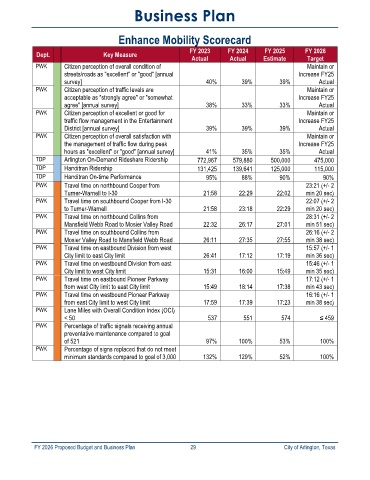
Business Plan


                                        Enhance Mobility Scorecard
                                                                FY 2023     FY 2024      FY 2025      FY 2026
             Dept.                 Key Measure
                                                                Actual       Actual     Estimate       Target
             PWK      Citizen perception of overall condition of                                       Maintain or
                      streets/roads as "excellent" or "good" [annual                                Increase FY25
                      survey]                                        40%         39%          39%          Actual
             PWK      Citizen perception of traffic levels are                                         Maintain or
                      acceptable as "strongly agree" or "somewhat                                   Increase FY25
                      agree" [annual survey]                         38%         33%          33%          Actual
             PWK      Citizen perception of excellent or good for                                      Maintain or
                      traffic flow management in the Entertainment                                  Increase FY25
                      District [annual survey]                       39%         39%          39%          Actual
             PWK      Citizen perception of overall satisfaction with                                  Maintain or
                      the management of traffic flow during peak                                    Increase FY25
                      hours as "excellent" or "good" [annual survey]   41%       35%          35%          Actual
             TDP      Arlington On-Demand Rideshare Ridership     772,967     579,880      500,000       475,000
             TDP      Handitran Ridership                         131,425     139,641      125,000       115,000
             TDP      Handitran On-time Performance                  95%         88%          90%           90%
             PWK      Travel time on northbound Cooper from                                           23:21 (+/- 2
                      Turner-Warnell to I-30                        21:58       22:29        22:02    min 20 sec)
             PWK      Travel time on southbound Cooper from I-30                                      22:07 (+/- 2
                      to Turner-Warnell                             21:58       23:18        22:29    min 20 sec)
             PWK      Travel time on northbound Collins from                                          28:31 (+/- 2
                      Mansfield Webb Road to Mosier Valley Road     22:32       26:17        27:01    min 51 sec)
             PWK      Travel time on southbound Collins from                                          26:16 (+/- 2
                      Mosier Valley Road to Mansfield Webb Road     26:11       27:35        27:55    min 38 sec)
             PWK      Travel time on eastbound Division from west                                     15:57 (+/- 1
                      City limit to east City limit                 26:41       17:12        17:19    min 36 sec)
             PWK      Travel time on westbound Division from east                                     15:46 (+/- 1
                      City limit to west City limit                 15:31       16:00        15:49    min 35 sec)
             PWK      Travel time on eastbound Pioneer Parkway                                        17:12 (+/- 1
                      from west City limit to east City limit       15:49       18:14        17:38    min 43 sec)
             PWK      Travel time on westbound Pioneer Parkway                                        16:16 (+/- 1
                      from east City limit to west City limit       17:59       17:39        17:23    min 38 sec)
             PWK      Lane Miles with Overall Condition Index (OCI)
                      < 50                                            537         551         574          ≤ 459
             PWK      Percentage of traffic signals receiving annual
                      preventative maintenance compared to goal
                      of 521                                         97%        100%          53%          100%
             PWK      Percentage of signs replaced that do not meet
                      minimum standards compared to goal of 3,000    132%       129%          52%          100%


            FY 2026 Proposed Budget and Business Plan                                        29                                                                City of Arlington, Texas