
Page 165 - CityofArlingtonFY26AdoptedBudget
P. 165
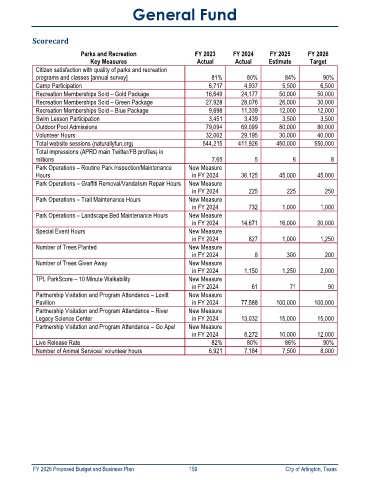
General Fund


            Scorecard
                            Parks and Recreation                  FY 2023     FY 2024     FY 2025      FY 2026
                               Key Measures                       Actual       Actual     Estimate      Target
             Citizen satisfaction with quality of parks and recreation
             programs and classes [annual survey]                      81%         80%         84%          90%
             Camp Participation                                       6,717       4,937       5,500        6,500
             Recreation Memberships Sold – Gold Package              16,649      24,177      50,000       50,000
             Recreation Memberships Sold – Green Package             27,928      28,076      26,000       30,000
             Recreation Memberships Sold – Blue Package               9,698      11,339      12,000       12,000
             Swim Lesson Participation                                3,451       3,439       3,500        3,500
             Outdoor Pool Admissions                                 79,094      69,099      80,000       80,000
             Volunteer Hours                                         32,002      29,195      30,000       40,000
             Total website sessions (naturallyfun.org)              544,215     411,926     450,000      550,000
             Total impressions (APRD main Twitter/FB profiles) in
             millions                                                  7.65          5            6            8
             Park Operations – Routine Park Inspection/Maintenance   New Measure
             Hours                                               in FY 2024      36,125      45,000       45,000
             Park Operations – Graffiti Removal/Vandalism Repair Hours   New Measure
                                                                 in FY 2024        225          225          250
             Park Operations – Trail Maintenance Hours         New Measure
                                                                 in FY 2024        732        1,000        1,000
             Park Operations – Landscape Bed Maintenance Hours    New Measure
                                                                 in FY 2024      14,671      16,000       20,000
             Special Event Hours                               New Measure
                                                                 in FY 2024        827        1,000        1,250
             Number of Trees Planted                           New Measure
                                                                 in FY 2024          8          300          200
             Number of Trees Given Away                        New Measure
                                                                 in FY 2024       1,150       1,250        2,000
             TPL ParkScore – 10 Minute Walkability             New Measure
                                                                 in FY 2024         61           71           90
             Partnership Visitation and Program Attendance – Levitt   New Measure
             Pavilion                                            in FY 2024      77,588     100,000      100,000
             Partnership Visitation and Program Attendance – River   New Measure
             Legacy Science Center                               in FY 2024      13,032      15,000       15,000
             Partnership Visitation and Program Attendance – Go Ape!   New Measure
                                                                 in FY 2024       8,272      10,000       12,000
             Live Release Rate                                         82%         80%         86%          90%
             Number of Animal Services’ volunteer hours               6,921       7,184       7,500        8,000


            FY 2026 Proposed Budget and Business Plan                                        159                                                                City of Arlington, Texas