
Page 153 - CityofArlingtonFY26AdoptedBudget
P. 153
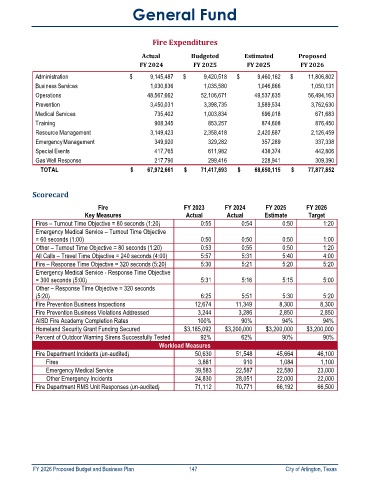
General Fund


                                                   Fire Expenditures

                                                Actual          Budgeted          Estimated         Proposed
                                               FY 2024           FY 2025           FY 2025          FY 2026
             Administration                 $                9,145,487  $                9,420,518  $                9,460,162  $             11,806,802
             Business Services                                1,030,836                    1,035,580                    1,046,866                    1,050,131
             Operations                                     48,567,662                  52,106,671                  49,537,635                  56,494,163
             Prevention                                       3,450,031                    3,398,735                    3,589,534                    3,762,630
             Medical Services                                    735,402                    1,003,834                       696,018                       671,683
             Training                                            908,345                       853,257                       874,608                       876,450
             Resource Management                              3,149,423                    2,358,418                    2,420,687                    2,126,459
             Emergency Management                                349,920                       329,282                       357,289                       337,338
             Special Events                                      417,765                       611,982                       438,374                       442,806
             Gas Well Response                                   217,790                       299,416                       228,941                       309,390
                 TOTAL                      $             67,972,661  $             71,417,693  $             68,650,115  $             77,877,852


            Scorecard

                                 Fire                         FY 2023      FY 2024       FY 2025      FY 2026
                             Key Measures                      Actual       Actual       Estimate      Target
             Fires – Turnout Time Objective = 80 seconds (1:20)    0:55          0:54         0:50          1:20
             Emergency Medical Service – Turnout Time Objective
             = 60 seconds (1:00)                                   0:50          0:50         0:50          1:00
             Other – Turnout Time Objective = 80 seconds (1:20)    0:53          0:55         0:50          1:20
             All Calls – Travel Time Objective = 240 seconds (4:00)   5:57       5:31         5:40          4:00
             Fire – Response Time Objective = 320 seconds (5:20)   5:30          5:21         5:20          5:20
             Emergency Medical Service - Response Time Objective
             = 300 seconds (5:00)                                  5:31          5:16         5:15          5:00
             Other – Response Time Objective = 320 seconds
             (5:20)                                                6:25          5:51         5:30          5:20
             Fire Prevention Business Inspections                12,674        11,349        8,300         8,300
             Fire Prevention Business Violations Addressed        3,244         3,286        2,850         2,850
             AISD Fire Academy Completion Rates                   100%           90%          94%           94%
             Homeland Security Grant Funding Secured          $3,185,092   $3,200,000    $3,200,000   $3,200,000
             Percent of Outdoor Warning Sirens Successfully Tested   92%         62%          90%           90%
                                                      Workload Measures
             Fire Department Incidents (un-audited)               50,630       51,548        45,664       46,100
                Fires                                              3,881          910         1,084        1,100
                Emergency Medical Service                         39,583       22,587        22,580       23,000
                    Other Emergency Incidents                     24,830       28,051        22,000       22,000
             Fire Department RMS Unit Responses (un-audited)      71,112       70,771        66,192       66,500


            FY 2026 Proposed Budget and Business Plan                                        147                                                                City of Arlington, Texas