
Page 113 - TownofWestlakeFY25BudgetOrd1005
P. 113
Parks and Information Human Commun-
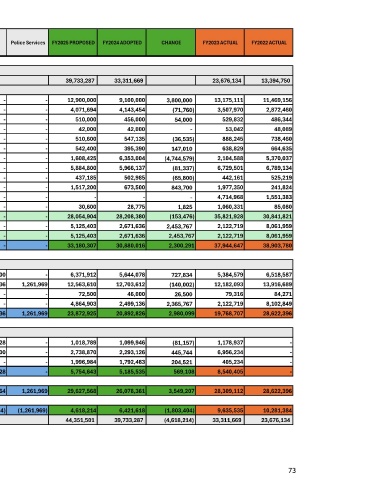
Department Police Services FY2025 PROPOSED FY2024 ADOPTED CHANGE FY2023 ACTUAL FY2022 ACTUAL
Recreation Technology Resources ications
ALL FUNDS
BEGINNING FUND BALANCE 39,733,287 33,311,669 23,676,134 13,394,750
REVENUES AND OTHER SOURCES
General Sales Tax 12,900,000 9,100,000 3,800,000 13,175,111 11,469,156
3,507,970
Property Tax 4,071,694 4,143,454 ( 71,760) 2,872,460
Hotel Occupancy Tax 510,000 456,000 54,000 529,832 486,344
53,
Beverage Tax 42,000 42,000 - 042 48,089
Franchise Fees 510,600 547,135 ( 36,535) 738,460
888,245
Permits & Fees Other 542,400 395,390 147,010 638,829 664,635
Permits & Fees Building 1,608,425 6,353,004 ( 4,744,579) 5,370,037
2,104,588
Charge for Services 5,884,800 5,966,137 ( 81,337) 6,789,134
6,729,501
442,161
Fines and Forfeitures 437,185 502,985 ( 65,800) 525,219
Investment Earnings 1,517,200 673,500 843,700 1,977,350 241,824
Contributions 4,714,968 1,551,383
Misc Income 30,600 28,775 1,825 1,060,331 85,080
Total Revenues 28,054,904 28,208,380 (153,476) 35,821,928 30,841,821
Transfers In 5,125,403 2,671,636 2,453,767 2,122,719 8,061,959
Total Other Sources 5,125,403 2,671,636 2,453,767 2,122,719 8,061,959
TOTAL REVENUES AND OTHER SOURCES 33,180,307 30,880,016 2,300,291 37,944,647 38,903,780
FY2025 EXPENDITURES AND OTHER USES
371,
6,
Total Payroll & Related 305,347 136,696 227,600 - 912 5,644,078 727,834 5,384,579 6,518,587
12,182,093
Total Operations 368,400 395,432 47,739 175,536 1,261,969 12,563,610 12,703,612 ( 140,002) 13,916,689
Facilities Expenditures 72,500 46,000 26,500 79,316 84,271
Transfers Out 4,864,903 2,499,136 2,365,767 2,122,719 8,102,849
TOTAL EXPENDITURES AND OTHER USES 368,400 700,779 184,435 403,136 1,261,969 23,872,925 20,892,826 2,980,099 19,768,707 28,622,396
FY2025 WA SHARED SERVICES
1,
Total Payroll & Related 246,533 136,696 134,328 - 018,789 1,099,946 ( 81,157)
1,178,937 -
738,
2,
11,
Total Operations 318,275 - 400 - 870 2,293,126 445,744 6,956,234 -
Transfers Out 1,996,984 1,792,463 204,521 405,234 -
5,
TOTAL WA SHARED SERVICES 564,808 136,696 145,728 - 643 5,185,535 569,108 8,540,405 -
754,
TOTAL EXPENDITURES 368,400 1,265,587 321,131 548,864 1,261,969 29,627,568 26,078,361 3,549,207 28,309,112 28,622,396
1,
TOTAL SURPLUS (DEFICIT) 368,400) (1,265,587) (321,131) (548,864) (1,261,969) 4,618,214 6,421,618 (803,404) 9,635,535 10,281,384
ENDING FUND BALANCE 44,351,501 39,733,287 (4,618,214) 33,311,669 23,676,134
73