Page 111 - TownofWestlakeFY25BudgetOrd1005
P. 111

Town Manager' s  Planning and  Town Secretary's  Fire/EMS  Public  Facilities  Finance
 Department  Council  General Services  Municipal Court
 Office  Development  Office  Department          Works      Maintenance    Department
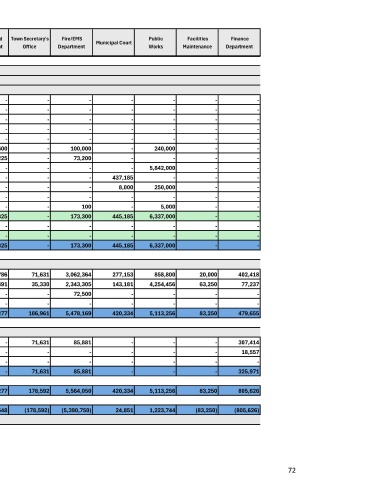

 ALL FUNDS
 BEGINNING FUND BALANCE
 REVENUES AND OTHER SOURCES
 General Sales Tax                                 -             12,900,000                                 -                                 -                                 -                                 -                                 -                                 -                                 -                                 -
 Property Tax                                 -                4,071,694                                 -                                 -                                 -                                 -                                 -                                 -                                 -                                 -
 Hotel Occupancy Tax                                 -                    510,000                                 -                                 -                                 -                                 -                                 -                                 -                                 -                                 -
 Beverage Tax                                 -                       42,000                                 -                                 -                                 -                                 -                                 -                                 -                                 -                                 -
 Franchise Fees                                 -                    510,600                                 -                                 -                                 -                                 -                                 -                                 -                                 -                                 -
 Permits & Fees Other                                 -                    102,800                                 -                   600                                 -                000                                 -                000                                 -                                 -
                        100,
                                                    240,
 99,
 Permits & Fees Building                                 -                                   -                                 -              1,535,225                                 -                   200                                 -                                 -                                 -                                 -
                         73,
                                                    842,
                                                  5,
 Charge for Services                                 -                       42,800                                 -                                 -                                 -                                 -                                 -            000                                 -                                 -
                                      437,
 Fines and Forfeitures                                 -                                   -                                 -                                 -                                 -                                 -                185                                 -                                 -                                 -
                                                    250,
                                          000
 Investment Earnings                                 -                1,259,200                                 -                                 -                                 -                                 -                      000                                 -                                 -
                                        8,
 Contributions                                 -                                   -                                 -                                 -                                 -                                 -                                 -                                 -                                 -                                 -
                                                      5,
 Misc Income                                 -                       25,500                                 -                                 -                                 -                          100                                 -                      000                                 -                                 -
 Total Revenues                                 -             19,464,594                                 -            634,825                                 -                300  445,185  6,337,000                                 -                                 -
                        173,
 1,
 Transfers In                                 -                5,125,403                                 -                                 -                                 -                                 -                                 -                                 -                                 -                                 -
 Total Other Sources                                 -                5,125,403                                 -                                 -                                 -                                 -                                 -                                 -                                 -                                 -
 TOTAL REVENUES AND OTHER SOURCES  24,589,997                                 -            634,825                                 -                300  445,185  6,337,000                                 -                                 -
 1,
                        173,
 FY2025 EXPENDITURES AND OTHER USES
 Total Payroll & Related                                 -                       75,851  452,266  481,786  71,631  3,062,364  277,153  858,800  20,000  402,418
 Total Operations  36,450  3,120,247  56,587  184,491  35,330  2,343,305  143,181  4,254,456  63,250  77,237
 Facilities Expenditures                                 -                                   -                                 -                                 -                                 -                    72,500                                 -                                 -                                 -                                 -
 Transfers Out                                 -                4,864,903                                 -                                 -                                 -                                 -                                 -                                 -                                 -                                 -
 TOTAL EXPENDITURES AND OTHER USES  36,450  6,995,526  508,853  666,277  106,961  5,478,169  420,334  5,113,256  83,250  479,655


 FY2025 WA SHARED SERVICES
                                                                                307,
                                                                                   414
           71,
 Total Payroll & Related                                 -                                   -                     36,306                                 -                   631  85,881                                 -                                 -                                 -
                                                                                 18,
                                                                                   557
 Total Operations  5,000  2,385,638                                 -                                 -                                 -                                 -                                 -                                 -                                 -
 Transfers Out                                 -                1,996,984                                 -                                 -                                 -                                 -                                 -                                 -                                 -                                 -
 TOTAL WA SHARED SERVICES  5,000  4,382,622  36,306                                 -                     85,881                                 -                                 -                                 -
                                                                                325,
              631
           71,
                                                                                   971
 TOTAL EXPENDITURES  41,450  11,378,148  545,159  666,277  178,592  5,564,050  420,334  5,113,256  83,250  805,626
 TOTAL SURPLUS (DEFICIT)   41,450)          13,211,849              (545,159)               968,548              (178,592)        (5,390,750)                  24,851  1,223,744                 (83,250)             (805,626)
 ENDING FUND BALANCE


                                                                                                72
   106   107   108   109   110   111   112   113   114   115   116