
Page 46 - CityofWataugaAdoptedBudgetFY25
P. 46
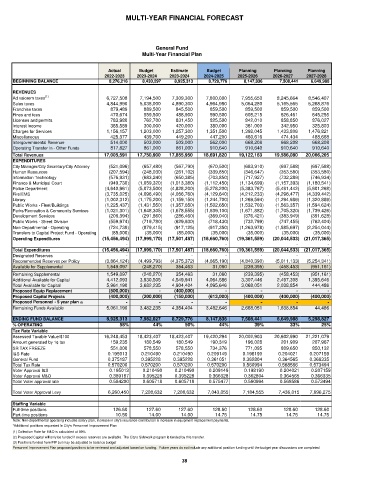
MULTI-YEAR FINANCIAL FORECAST


                                                     General Fund
                                                Multi-Year Financial Plan

                                     Actual    Budget     Estimate   Budget     Planning    Planning   Planning
                                    2022-2023  2023-2024  2023-2024  2024-2025  2025-2026  2026-2027  2027-2028

     BEGINNING BALANCE                     8,276,216              8,430,297             8,925,313           8,729,776              8,147,836                7,508,441          6,649,988
     REVENUES


     Ad valorem taxes (1)               6,727,508           7,194,500        7,309,300        7,800,000          7,955,650           8,245,664       8,546,407

     Sales taxes                        4,844,990           5,038,000        4,890,300        4,964,980          5,064,280           5,165,565         5,268,876


     Franchise taxes                       879,489            889,500           845,500           859,500             859,500              859,500            859,500


     Fines and fees                        470,674            559,500           488,900           590,500               608,215              626,461          645,255


     Licenses and permits                  783,980            762,700           831,450           825,500               842,010              858,850            876,027


     Interest Income                       385,589            300,000           420,000           380,000               361,000              342,950            325,803


     Charges for Services               1,156,157         1,203,000          1,257,300        1,351,500          1,392,045           1,433,806         1,476,821


     Miscellaneous                         425,377            439,700           449,200           447,200               460,616              474,434            488,668


     Intergovernmental Revenue             514,000            503,000           503,000           562,000             668,208              668,208            668,208

     Operating Transfer In - Other Funds           817,827            861,000           861,000           910,640             910,640              910,640          910,640


     Total Revenues                   17,005,591       17,750,900      17,855,950      18,691,820        19,122,163         19,586,080     20,066,205
     EXPENDITURES
     City Manager/City Secretary/City Attorney          (521,096)          (657,480)         (567,790)          (670,500)           (683,910)            (697,588)         (697,588)
     Human Resources                      (207,594)          (248,030)         (261,102)          (339,850)           (346,647)            (353,580)         (353,580)
     Information Technology               (576,931)          (683,240)         (650,385)          (703,850)           (717,927)            (732,289)         (746,934)
     Finance & Municipal Court            (949,730)       (1,059,320)      (1,013,380)       (1,112,450)        (1,134,699)         (1,157,393)      (1,180,541)
     Police Department                 (4,640,961)       (5,073,500)      (4,828,200)       (5,278,200)        (5,383,767)         (5,491,442)      (5,601,268)
     Fire/EMS                          (3,735,025)       (4,096,490)      (4,066,760)       (4,129,640)        (4,212,233)         (4,296,477)      (4,339,442)
     Library                           (1,002,312)       (1,175,200)      (1,159,150)       (1,244,700)        (1,269,594)         (1,294,986)      (1,320,886)
     Public Works - Fleet/Buildings       (1,225,437)       (1,431,550)      (1,357,650)       (1,502,650)        (1,532,703)         (1,563,357)      (1,594,624)
     Parks/Recreation & Community Services       (1,021,301)       (1,648,305)      (1,678,555)       (1,639,100)        (1,671,882)         (1,705,320)      (1,739,426)
     Development Services                 (206,394)          (291,860)         (286,460)          (369,040)           (376,421)            (383,949)         (391,628)
     Public Works - Street Division          (559,974)          (719,780)         (629,930)          (718,430)           (732,799)            (747,455)         (762,404)
     Non-Departmental - Operating          (724,739)          (879,415)         (917,125)          (917,350)        (1,263,978)         (1,585,697)      (2,254,044)
     Transfers to Capital Project Fund - Operating            (85,000)            (35,000)           (85,000)            (35,000)             (35,000)              (35,000)           (35,000)
     Operating Expenditures          (15,456,494)     (17,999,170)    (17,501,487)     (18,660,760)      (19,361,559)       (20,044,533)    (21,017,365)
                                                       -                        -                       -                       -                         -                          -                      -
     Total Expenditures              (15,456,494)     (17,999,170)    (17,501,487)     (18,660,760)      (19,361,559)       (20,044,533)    (21,017,365)
     Designated Reserves                               -                        -                       -                       -                         -                          -                      -
     Recommended Reserves per Policy       (3,864,124)       (4,499,793)      (4,375,372)       (4,665,190)        (4,840,390)         (5,011,133)      (5,254,341)
     Available for Supplemental         1,549,097           (248,270)           354,463             31,060            (239,395)            (458,453)         (951,161)
     Remaining Supplemental             1,549,097           (248,270)           354,463             31,060            (239,395)            (458,453)         (951,161)

     Additional Available for Capital        4,412,093           3,930,505          4,549,941        4,064,586          3,307,446           2,497,308         1,395,646


     Total Available for Capital        5,961,190         3,682,235        4,904,404        4,095,646          3,068,051           2,038,854          444,486
     Proposed Equip Replacement           (500,000)                       -          (400,000)                       -                         -                          -                      -
     Proposed Capital Projects            (400,000)          (200,000)         (150,000)          (613,000)           (400,000)            (400,000)         (400,000)
                                                       -                        -                       -                       -                         -                          -                      -
     Proposed Personnel - 5 year plan (3)

     Remaining Funds Available          5,061,190           3,482,235        4,354,404        3,482,646          2,668,051           1,638,854            44,486


     ENDING FUND BALANCE                8,925,313           7,982,027          8,729,776        8,147,836          7,508,441           6,649,988       5,298,827

     % OPERATING                         58%        44%       50%         44%        39%         33%       25%
     Tax Rate Variable


     Assessed Taxable Value/$100      16,248,453       18,423,407      18,423,407      19,420,294        20,002,903         20,602,990       21,221,079


     Amount generated by 1¢ tax             159,235            180,549           180,549           190,319             196,028              201,909          207,967
     SR TAX FREEZE                    551,000    578,550   578,550    734,376     771,095     809,650   850,132
     I&S Rate                        0.195013   0.210490  0.210490    0.209149   0.198190    0.204021  0.207159
     General Fund                    0.375187   0.395228  0.395228    0.361051   0.362804    0.364565  0.366335
     Total Tax Rate                  0.570200   0.570200  0.570200    0.570200   0.560994    0.568586  0.573494
     Voter Approval I&S              0.195013   0.210490   0.210490   0.209149    0.198190    0.204021  0.207159
     Voter Approval M&O              0.389187   0.395228   0.395228   0.366328    0.362804    0.364565  0.366335
     Total Voter approval rate       0.584200   0.605718   0.605718   0.575477    0.560994    0.568586  0.573494
     Total Voter Approval Levy       6,260,450  7,208,632  7,208,632  7,043,055  7,184,555   7,436,015  7,696,275
     Staffing Variable
     Full-time positions              126.60     127.60     127.60     128.60      128.60      128.60    128.60
     Part-time positions               10.50      14.00      14.00      14.75       14.75       14.75     14.75
     Note: Non-departmental operating includes salary plan, Increase in city's insurance contribution & increase in equipment replacement payments.
     *Additional positions requested in City's Personnel Improvement Plan
     (1) Collection Rate for M&O is calculated at 99%
     (2) Proposed Capital will only be funded if excess reserves are available. The City's Sidewalk program is funded by this transfer.
     (3) Positions funded from PIP but may be adjusted to balance budget
     Personnel Improvement Plan proposed positions to be reviewed and adjusted based on funding.  Future years do not include any additional position funding until the budget year discussions are completed.
                                                             38