
Page 137 - CityofWataugaAdoptedBudgetFY25
P. 137
BUDGET SUMMARY
10 YEAR HISTORY OF PROPERTY TAX RATES
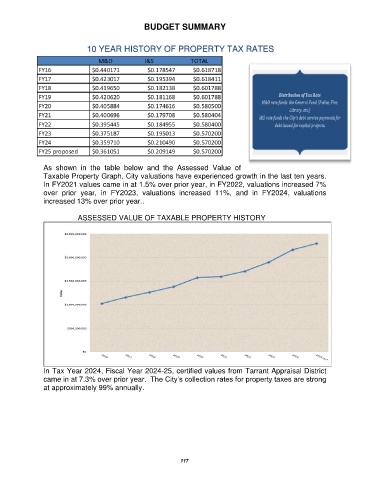
As shown in the table below and the Assessed Value of
Taxable Property Graph, City valuations have experienced growth in the last ten years.
In FY2021 values came in at 1.5% over prior year, in FY2022, valuations increased 7%
over prior year, in FY2023, valuations increased 11%, and in FY2024, valuations
increased 13% over prior year..
ASSESSED VALUE OF TAXABLE PROPERTY HISTORY
In Tax Year 2024, Fiscal Year 2024-25, certified values from Tarrant Appraisal District
came in at 7.3% over prior year. The City’s collection rates for property taxes are strong
at approximately 99% annually.
117