
Page 161 - CityofKellerFY25Budget
P. 161
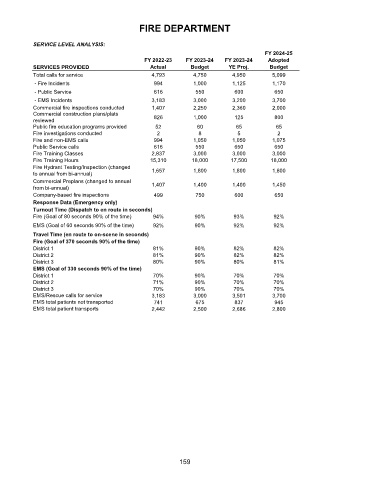
FIRE DEPARTMENT

            SERVICE LEVEL ANALYSIS:
                                                                                         FY 2024-25
                                                 FY 2022-23    FY 2023-24   FY 2023-24    Adopted
            SERVICES PROVIDED                      Actual       Budget       YE Proj.     Budget
            Total calls for service                4,793         4,750        4,950        5,099
             - Fire Incidents                       994          1,000        1,125        1,170
             - Public Service                       616           550          600          650
             - EMS Incidents                       3,183         3,000        3,200        3,700
            Commercial fire inspections conducted  1,407         2,250        2,360        2,000
            Commercial construction plans/plats
            reviewed                                826          1,000         125          800
            Public fire education programs provided  52           60           65           65
            Fire investigations conducted            2             8            5            2
            Fire and non-EMS calls                  994          1,050        1,050        1,075
            Public Service calls                    616           550          650          650
            Fire Training Classes                  2,837         3,000        3,000        3,000
            Fire Training Hours                    15,310       18,000       17,500        18,000
            Fire Hydrant Testing/Inspection (changed
            to annual from bi-annual)              1,657         1,800        1,800        1,800
            Commercial Preplans (changed to annual
            from bi-annual)                        1,407         1,400        1,400        1,450
            Company-based fire inspections          499           750          600          650
            Response Data (Emergency only)
            Turnout Time (Dispatch to en route in seconds)
            Fire (Goal of 80 seconds 90% of the time)  94%       90%          93%           92%
            EMS (Goal of 60 seconds 90% of the time)  92%        90%          92%           92%
            Travel Time (en route to on-scene in seconds)
            Fire (Goal of 370 seconds 90% of the time)
            District 1                              81%          90%          82%           82%
            District 2                              81%          90%          82%           82%
            District 3                              80%          90%          80%           81%
            EMS (Goal of 330 seconds 90% of the time)
            District 1                              70%          90%          70%           70%
            District 2                              71%          90%          70%           70%
            District 3                              70%          90%          70%           70%
            EMS/Rescue calls for service           3,183         3,000        3,501        3,700
            EMS total patients not transported      741           675          837          945
            EMS total patient transports           2,442         2,500        2,686        2,800


                                                            159