
Page 52 - HaltomCityFY25Budget
P. 52
City Of Haltom City Annual Budget, FY2025 Budget Overview
CHARGES FOR SERVICES
Fees and charges for services provided by the City such as inspection, facility rentals, reports, parks and
recreation, garage sales, water and sewer, and drainage.
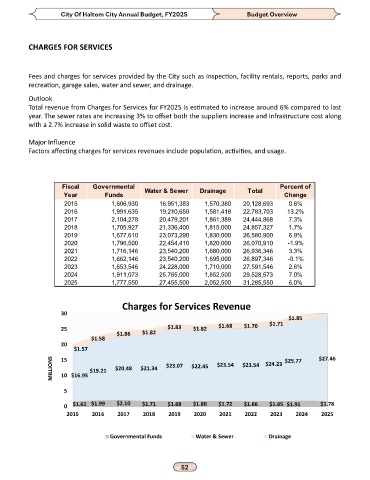
Outlook
Total revenue from Charges for Services for FY2025 is estimated to increase around 6% compared to last
year. The sewer rates are increasing 3% to offset both the suppliers increase and infrastructure cost along
with a 2.7% increase in solid waste to offset cost.
Major Influence
Factors affecting charges for services revenues include population, activities, and usage.
Fiscal Governmental Water & Sewer Drainage Total Percent of
Year Funds Change
2015 1,606,930 16,951,383 1,570,380 20,128,693 0.6%
2016 1,991,635 19,210,650 1,581,418 22,783,703 13.2%
2017 2,104,278 20,479,201 1,861,389 24,444,868 7.3%
2018 1,705,927 21,336,400 1,815,000 24,857,327 1.7%
2019 1,677,610 23,073,290 1,830,000 26,580,900 6.9%
2020 1,796,500 22,454,410 1,820,000 26,070,910 -1.9%
2021 1,716,146 23,540,200 1,680,000 26,936,346 3.3%
2022 1,662,146 23,540,200 1,695,000 26,897,346 -0.1%
2023 1,653,546 24,228,000 1,710,000 27,591,546 2.6%
2024 1,911,073 25,765,000 1,852,500 29,528,573 7.0%
2025 1,777,550 27,455,500 2,052,500 31,285,550 6.0%
Charges for Services Revenue
30
$1.85
25 $1.86 $1.82 $1.83 $1.82 $1.68 $1.70 $1.71
$1.58
20
$1.57 $27.46
MILLIONS 15 $16.95 $19.21 $20.48 $21.34 $23.07 $22.45 $23.54 $23.54 $24.23 $25.77
10
5
0 $1.61 $1.99 $2.10 $1.71 $1.68 $1.80 $1.72 $1.66 $1.65 $1.91 $1.78
2015 2016 2017 2018 2019 2020 2021 2022 2023 2024 2025
Governmental Funds Water & Sewer Drainage