
Page 48 - HaltomCityFY25Budget
P. 48
City Of Haltom City Annual Budget, FY2025 Budget Overview
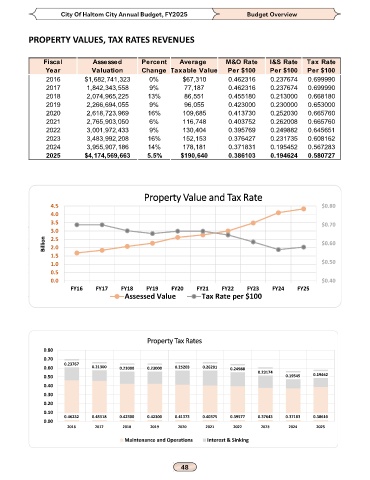
PROPERTY VALUES, TAX RATES REVENUES
Fiscal Assessed Percent Average M&O Rate I&S Rate Tax Rate
Year Valuation Change Taxable Value Per $100 Per $100 Per $100
2016 $1,682,741,323 0% $67,310 0.462316 0.237674 0.699990
2017 1,842,343,558 9% 77,187 0.462316 0.237674 0.699990
2018 2,074,965,225 13% 86,551 0.455180 0.213000 0.668180
2019 2,266,694,055 9% 96,055 0.423000 0.230000 0.653000
2020 2,618,723,969 16% 109,685 0.413730 0.252030 0.665760
2021 2,765,903,050 6% 116,748 0.403752 0.262008 0.665760
2022 3,001,972,433 9% 130,404 0.395769 0.249882 0.645651
2023 3,483,992,208 16% 152,153 0.376427 0.231735 0.608162
2024 3,955,907,186 14% 178,181 0.371831 0.195452 0.567283
2025 $4,174,569,663 5.5% $190,640 0.386103 0.194624 0.580727
Property Value and Tax Rate
4.5 $0.80
4.0
3.5 $0.70
3.0
Billion 2.5 $0.60
2.0
1.5
1.0 $0.50
0.5
0.0 $0.40
FY16 FY17 FY18 FY19 FY20 FY21 FY22 FY23 FY24 FY25
Assessed Value Tax Rate per $100
Property Tax Rates
0.80
0.70
0.23767
0.60 0.21300 0.23000 0.23000 0.25203 0.26201 0.24988
0.50 0.23174 0.19545 0.19462
0.40
0.30
0.20
0.10
0.46232 0.45518 0.42300 0.42300 0.41373 0.40375 0.39577 0.37643 0.37183 0.38610
0.00
2016 2017 2018 2019 2020 2021 2022 2023 2024 2025
Maintenance and Operations Interest & Sinking