
Page 476 - Bedford-FY24-25 Budget
P. 476
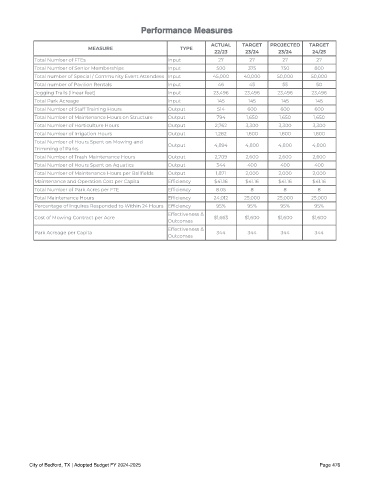
Performance Measures


                                                                       ACTUAL    TARGET   PROJECTED    TARGET
                              MEASURE                        TYPE
                                                                        22 /23    23/24      23/24      24 /25
            Total Number of FTEs                         Input           27         27        27          27
            Total Number of Senior Memberships           Input           500       375        750        800
            Total number of Special / Community Event Attendees Input  45,000     40,000     50,000     50,000
            Total number of Pavilion Rentals             Input           46        45         55          50
            Jogging Trails (linear feet)                 Input          23,496    23,496     23,496     23,496
            Total Park Acreage                           Input           145       145        145        145
            Total Number of Staff Training Hours         Output          514       600        600        600
            Total Number of Maintenance Hours on Structure  Output       794       1,650     1,650       1,650
            Total Number of Horticulture Hours           Output         2,762     3,300      3,300       3,300
            Total Number of Irrigation Hours             Output         1,282     1,600      1,600       1,600
            Total Number of Hours Spent on Mowing and
            Trimming of Parks                            Output         4,894     4,800      4,800      4,800
            Total Number of Trash Maintenance Hours      Output         2,709     2,600      2,600      2,600
            Total Number of Hours Spent on Aquatics      Output          344       400        400        400
            Total Number of Maintenance Hours per Ball elds  Output     1,871     2,000      2,000      2,000
            Maintenance and Operation Cost per Capita    Ef ciency      $41.16    $41.16     $41.16     $41.16
            Total Number of Park Acres per FTE           Ef ciency      8.05        8          8          8
            Total Maintenance Hours                      Ef ciency      24,012    25,000     25,000     25,000
            Percentage of Inquires Responded to Within 24 Hours Ef ciency  95%     95%        95%        95%
                                                         Effectiveness &
            Cost of Mowing Contract per Acre                            $1,663    $1,600     $1,600     $1,600
                                                         Outcomes
                                                         Effectiveness &
            Park Acreage per Capita                                      344       344        344        344
                                                         Outcomes


           City of Bedford, TX | Adopted Budget FY 2024-2025                                               Page 476