Page 403 - Bedford-FY24-25 Budget
P. 403

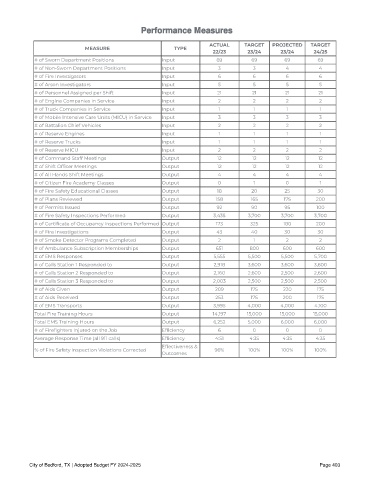
Performance Measures


                                                                      ACTUAL      TARGET   PROJECTED    TARGET
                             MEASURE                       TYPE
                                                                       22 /23      23/24      23/24      24 /25
            # of Sworn Department Positions            Input             69         69         69         69
            # of Non-Sworn Department Positions        Input             3           3          4          4
            # of Fire Investigators                    Input             6           6          6          6
            # of Arson Investigators                   Input             5           5          5          5
            # of Personnel Assigned per Shift          Input             21         21         21         21
            # of Engine Companies in Service           Input             2           2          2          2
            # of Truck Companies in Service            Input             1           1          1          1
            # of Mobile Intensive Care Units (MICU) in Service  Input    3           3          3          3
            # of Battalion Chief Vehicles              Input             2           2          2          2
            # of Reserve Engines                       Input             1           1          1          1
            # of Reserve Trucks                        Input             1           1          1          1
            # of Reserve MICU                          Input             2           2          2          2
            # of Command Staff Meetings                Output            12         12         12         12
            # of Shift Of cer Meetings                 Output            12         12         12         12
            # of All Hands Shift Meetings              Output            4           4          4          4
            # of Citizen Fire Academy Classes          Output            0           1          0          1
            # of Fire Safety Educational Classes       Output            18         20         25         30
            # of Plans Reviewed                        Output           158         165        175        200
            # of Permits Issued                        Output            92         90         95         100
            # of Fire Safety Inspections Performed     Output           3,435      3,700      3,700      3,700
            # of Certi cate of Occupancy Inspections Performed Output   173         325        180        200
            # of Fire Investigations                   Output            43         40         30         30
            # of Smoke Detector Programs Completed     Output            2           1          2          2
            # of Ambulance Subscription Memberships    Output           651         800        600        600
            # of EMS Responses                         Output           5,555      5,500      5,500      5,700
            # of Calls Station 1 Responded to          Output           2,918      3,600      3,600      3,600
            # of Calls Station 2 Responded to          Output           2,160      2,600      2,500      2,600
            # of Calls Station 3 Responded to          Output           2,003      2,500      2,500      2,500
            # of Aids Given                            Output           209         175        220        175
            # of Aids Received                         Output           253         175        200        175
            # of EMS Transports                        Output           3,995      4,000      4,000      4,100
            Total Fire Training Hours                  Output          14,197      15,000     15,000     15,000
            Total EMS Training Hours                   Output           6,252      5,000      6,000      6,000
            # of Fire ghters Injured on the Job        Ef ciency         6           0          0          0
            Average Response Time (all 911 calls)      Ef ciency        4:51        4:35       4:35      4:35
                                                       Effectiveness &
            % of Fire Safety Inspection Violations Corrected            96%        100%       100%       100%
                                                       Outcomes


           City of Bedford, TX | Adopted Budget FY 2024-2025                                               Page 403
   398   399   400   401   402   403   404   405   406   407   408