
Page 356 - Bedford-FY24-25 Budget
P. 356
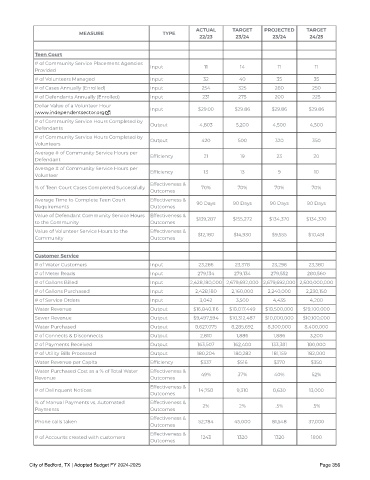
ACTUAL TARGET PROJECTED TARGET
MEASURE TYPE
22 /23 23/24 23/24 24 /25
Teen Cour t
# of Community Service Placement Agencies Input 11 14 11 11
Provided
# of Volunteers Managed Input 32 40 35 35
# of Cases Annually (Enrolled) Input 254 325 280 250
# of Defendants Annually (Enrolled) Input 231 275 200 225
Dollar Value of a Volunteer Hour Input $29.00 $29.86 $29.86 $29.86
(www.independentsector.org )
# of Community Service Hours Completed by Output 4,803 5,200 4,500 4,500
Defendants
# of Community Service Hours Completed by Output 420 500 320 350
Volunteers
Average # of Community Service Hours per
Defendant Ef ciency 21 19 23 20
Average # of Community Service Hours per
Volunteer Ef ciency 13 13 9 10
Effectiveness &
% of Teen Court Cases Completed Successfully 70% 70% 70% 70%
Outcomes
Average Time to Complete Teen Court Effectiveness & 90 Days 90 Days 90 Days 90 Days
Requirements Outcomes
Value of Defendant Community Service Hours Effectiveness & $139,287 $155,272 $134,370 $134,370
to the Community Outcomes
Value of Volunteer Service Hours to the Effectiveness & $12,180 $14,930 $9,555 $10,451
Community Outcomes
Customer Ser vice
# of Water Customers Input 23,266 23,378 23,296 23,380
# of Meter Reads Input 279,134 279,134 279,552 280,560
# of Gallons Billed Input 2,428,180,000 2,679,692,000 2,679,692,000 2,500,000,000
# of Gallons Purchased Input 2,428,180 2,160,000 2,240,000 2,230,150
# of Service Orders Input 3,042 3,500 4,435 4,200
Water Revenue Output $16,840,116 $18,017,449 $18,500,000 $19,100,000
Sewer Revenue Output $9,497,594 $10,312,487 $10,000,000 $10,100,000
Water Purchased Output 8,627,075 8,285,692 8,300,000 8,400,000
# of Connects & Disconnects Output 2,810 1,886 1,886 3,200
# of Payments Received Output 163,507 162,400 133,381 180,000
# of Utility Bills Processed Output 180,204 180,282 181,159 182,000
Water Revenue per Capita Ef ciency $337 $516 $370 $350
Water Purchased Cost as a % of Total Water Effectiveness & 49% 37% 40% 52%
Revenue Outcomes
Effectiveness &
# of Delinquent Notices 14,758 9,310 8,630 13,000
Outcomes
% of Manual Payments vs. Automated Effectiveness &
Payments Outcomes 2% 2% .5% .5%
Effectiveness &
Phone calls taken 52,784 45,000 81,548 37,000
Outcomes
Effectiveness &
# of Accounts created with customers 1243 1320 1320 1800
Outcomes
City of Bedford, TX | Adopted Budget FY 2024-2025 Page 356