
Page 138 - CityofWataugaAdoptedBudgetFY24
P. 138
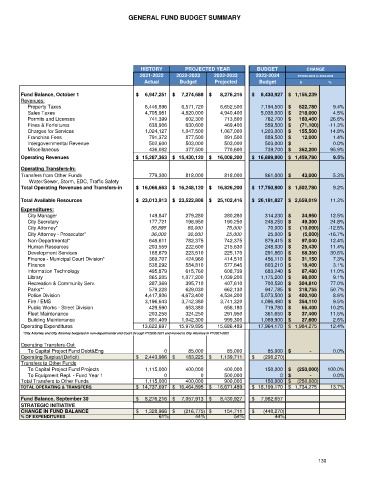
GENERAL FUND BUDGET SUMMARY


                                                HISTORY       PROJECTED YEAR             BUDGET       CHANGE
                                               2021-2022   2022-2023    2022-2023     2023-2024     FY2022-2023 to 2023-2024
                                                 Actual     Budget      Projected      Budget       $                            %

        Fund Balance, October 1               $      6,947,251  $      7,274,688  $        8,276,216  $      8,430,927  $    1,156,239
        Revenues:
             Property Taxes                      6,446,896   6,571,720    6,652,500    7,194,500  $       622,780  9.4%
             Sales Taxes                         4,705,981   4,820,000    4,940,400    5,038,000  $       218,000  4.5%
             Permits and Licenses                 741,399     602,300      713,800       762,700  $       160,400  26.6%
             Fines & Forfeitures                  638,906     630,600      469,400       559,500  $        (71,100)  -11.3%
             Charges for Services                1,024,127   1,047,500    1,067,000    1,203,000  $       155,500  14.8%
             Franchise Fees                       791,372     877,500      891,500       889,500  $         12,000  1.4%
             Intergovernmental Revenue            502,600     503,000      503,000       503,000  $               -  0.0%
             Miscellaneous                        436,082     377,500      770,600       739,700  $       362,200  95.9%
        Operating Revenues                    $    15,287,363  $    15,430,120  $      16,008,200  $    16,889,900  $    1,459,780  9.5%
        Operating Transfers-In:
        Transfers from Other Funds                779,300     818,000      818,000       861,000  $         43,000  5.3%
              Water/Sewer, Storm, EDC, Traffic Safety
        Total Operating Revenues and Transfers-in  $    16,066,663  $    16,248,120  $      16,826,200  $    17,750,900  $    1,502,780  9.2%

        Total Available Resources             $    23,013,913  $    23,522,808  $      25,102,416  $    26,181,827  $    2,659,019  11.3%
        Expenditures:
             City Manager                         149,847     279,280      280,280       314,230  $         34,950  12.5%
             City Secretary                       177,721     198,950      190,250       248,250  $         49,300  24.8%
             City Attorney*                        55,895      80,000       75,000        70,000  $        (10,000)  -12.5%
             City Attorney - Prosecutor*           36,000      30,000       25,000        25,000  $          (5,000)  -16.7%
             Non-Departmental*                    646,611     782,375      742,375       879,415  $         97,040  12.4%
             Human Resources                      203,559     222,600      215,630       248,030  $         25,430  11.4%
             Development Services                 168,679     223,510      225,170       291,860  $         68,350  30.6%
             Finance - Municipal Court Division*  369,707     424,960      414,510       456,110  $         31,150  7.3%
             Finance                              538,292     584,810      577,645       603,210  $         18,400  3.1%
             Information Technology               495,879     615,760      608,739       683,240  $         67,480  11.0%
             Library                              865,205    1,077,200    1,039,200    1,175,200  $         98,000  9.1%
             Recreation & Community Serv.         287,369     395,710      407,610       700,520  $       304,810  77.0%
             Parks**                              579,228     629,030      662,130       947,785  $       318,755  50.7%
             Police Division                     4,417,806   4,673,400    4,534,200    5,073,500  $       400,100  8.6%
             Fire / EMS                          3,196,643   3,742,380    3,741,320    4,096,490  $       354,110  9.5%
             Public Works - Street Division       429,590     653,380      656,180       719,780  $         66,400  10.2%
             Fleet Maintenance                    203,258     324,250      291,950       361,650  $         37,400  11.5%
             Building Maintenance                 801,409    1,042,300     999,300     1,069,900  $         27,600  2.6%
        Operating Expenditures                  13,622,697  15,979,895   15,686,489   17,964,170  $    1,984,275  12.4%
           *City Attorney and City Attorney budgeted in non-departmental and Court through FY2020-2021 and moved to City Attorney in FY2021-2022
        Operating Transfers-Out
             To Capital Project Fund Debt&Eng          0       85,000       85,000        85,000  $               -  0.0%
        Operating Surplus/(Deficit)           $      2,443,966  $         183,225  $        1,139,711  $        (298,270)
        Transfers to Other Funds
             To Capital Project Fund Projects    1,115,000    400,000      400,000       150,000  $      (250,000)  100.0%
             To Equipment Repl. - Fund Year 1          0           0       500,000            0  $               -  0.0%
        Total Transfers to Other Funds           1,115,000    400,000      900,000       150,000  $      (250,000)
        TOTAL OPERATING & TRANSFERS           $    14,737,697  $    16,464,895  $      16,671,489  $    18,199,170  $    1,734,275  13.7%

        Fund Balance, September 30            $      8,276,216  $      7,057,913  $        8,430,927  $      7,982,657
        STRATEGIC INITIATIVE
        CHANGE IN FUND BALANCE                $      1,328,966  $        (216,775) $           154,711  $        (448,270)
        % OF EXPENDITURES                             61%         44%         54%           44%


                                                                                                          130