
Page 421 - FY 24 Budget Forecast at Adoption.xlsx
P. 421
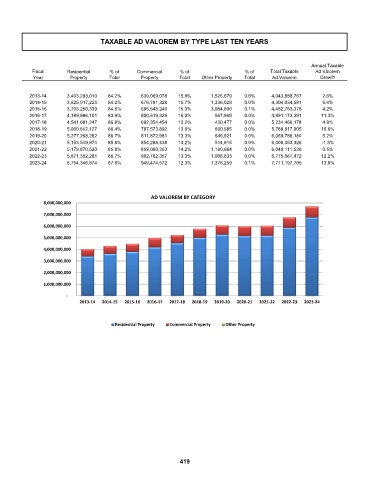
TAXABLE AD VALOREM BY TYPE LAST TEN YEARS


                                                                                                        Annual Taxable
            Fiscal     Residential   % of     Commercial     % of                 % of    Total Taxable  Ad Valorem
            Year        Property     Total      Property    Total   Other Property  Total  Ad Valorem      Growth


           2013-14          3,403,293,010  84.2%        639,069,078  15.8%        1,526,679  0.0%      4,043,888,767  2.6%
           2014-15        3,625,917,225  84.2%        676,781,328  15.7%        1,336,029  0.0%      4,304,034,581  6.4%


           2015-16          3,793,250,339  84.6%        685,548,240  15.3%        3,984,800  0.1%      4,482,783,378  4.2%


           2016-17        4,189,986,101  83.9%        800,619,329  16.0%           567,960  0.0%      4,991,173,391  11.3%

           2017-18        4,541,681,247  86.8%        692,354,454  13.2%             430,477  0.0%      5,234,466,178  4.9%


           2018-19        5,000,642,127  86.4%        787,573,892  13.6%             600,985  0.0%      5,788,817,005  10.6%
           2019-20          5,277,268,282  86.7%        811,872,981  13.3%             646,921  0.0%      6,089,788,184  5.2%


           2020-21        5,153,549,974  85.8%        854,288,438  14.2%           514,915  0.0%    6,008,353,326  -1.3%


           2021-22          5,179,870,520  85.8%        859,080,353  14.2%        1,160,664  0.0%      6,040,111,536  0.5%

           2022-23          5,871,352,281  86.7%        902,702,357  13.3%        1,006,833  0.0%    6,775,061,472  12.2%


           2023-24        6,754,346,874  87.6%        949,474,572  12.3%        7,376,259  0.1%      7,711,197,705  13.8%
                                                   AD VALOREM BY CATEGORY
                 8,000,000,000
                 7,000,000,000
                 6,000,000,000
                 5,000,000,000
                 4,000,000,000
                 3,000,000,000
                 2,000,000,000
                 1,000,000,000
                        -
                           2013-14  2014-15  2015-16  2016-17  2017-18  2018-19  2019-20  2020-21  2021-22  2022-23  2023-24
                                       Residential Property  Commercial Property  Other Property


                                                             419