
Page 186 - FY 24 Budget Forecast at Adoption.xlsx
P. 186
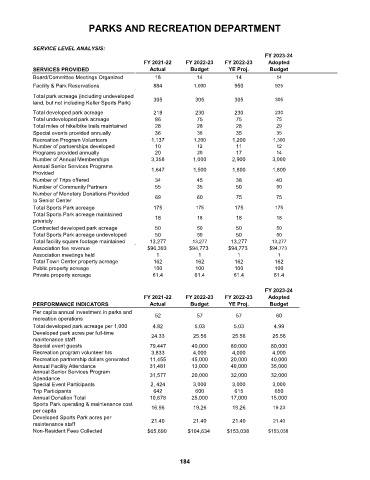
PARKS AND RECREATION DEPARTMENT


            SERVICE LEVEL ANALYSIS:
                                                                                         FY 2023-24
                                                 FY 2021-22   FY 2022-23   FY 2022-23     Adopted
            SERVICES PROVIDED                      Actual       Budget       YE Proj.     Budget
            Board/Committee Meetings Organized      18            14           14           14
            Facility & Park Reservations            884          1,000         950          925
            Total park acreage (including undeveloped   305       305          305
            land, but not including Keller Sports Park)                                     305
            Total developed park acreage            219           230          230          230
            Total undeveloped park acreage          86            75           75           75
            Total miles of hike/bike trails maintained  28        28           28           29
            Special events provided annually        36            36           35           35
            Recreation Program Volunteers          1,137         1,200        1,200        1,300
            Number of partnerships developed        10            12           11           12
            Programs provided annually              20            20           17           14
            Number of Annual Memberships           3,358         1,000        2,900        3,000
            Annual Senior Services Programs
            Provided                               1,647         1,500        1,800        1,800
            Number of Trips offered                 34            45           38           40
            Number of Community Partners            55            35           50           50
            Number of Monetary Donations Provided
            to Senior Center                        69            60           75           75
            Total Sports Park acreage               175           175          175          175
            Total Sports Park acreage maintained    18                         18
            privately                                             18                        18
            Contracted developed park acreage       50            50           50           50
            Total Sports Park acreage undeveloped   50            50           50           50
            Total facility square footage maintained  13,277     13,277      13,277        13,277
            Association fee revenue               $96,393       $94,773      $94,773      $94,773
            Association meetings held                1             1            1            1
            Total Town Center property acreage      162           162          162          162
            Public property acreage                 100           100          100          100
            Private property acreage                61.4         61.4         61.4          61.4

                                                                                         FY 2023-24
                                                 FY 2021-22   FY 2022-23   FY 2022-23     Adopted
            PERFORMANCE INDICATORS                 Actual       Budget       YE Proj.     Budget
            Per capita annual investment in parks and
            recreation operations                   52            57           57           60
            Total developed park acreage per 1,000   4.82        5.03         5.03          4.99
            Developed park acres per full-time     24.33         25.56        25.56        25.56
            maintenance staff
            Special event guests                   79,447       40,000       80,000        80,000
            Recreation program volunteer hrs       3,833         4,000        4,000        4,000
            Recreation partnership dollars generated  11,455    45,000       20,000        40,000
            Annual Facility Attendance             31,481       13,000       40,000        35,000
            Annual Senior Services Program         31,577       20,000       32,000        32,000
            Attendance
            Special Event Participants             2, 424        3,000        3,000        3,000
            Trip Participants                       642           600          615          650
            Annual Donation Total                  10,678       25,000       17,000        15,000
            Sports Park operating & maintenance cost
            per capita                             16.96         19.26        19.26        19.23
            Developed Sports Park acres per
            maintenance staff                      21.40         21.40        21.40        21.40
            Non-Resident Fees Collected                                              $104,634  $153,038  $153,038
                                                  $65,690


                                                             184