
Page 180 - FY 24 Budget Forecast at Adoption.xlsx
P. 180
LIBRARY
LIBRARY (100-60-601)
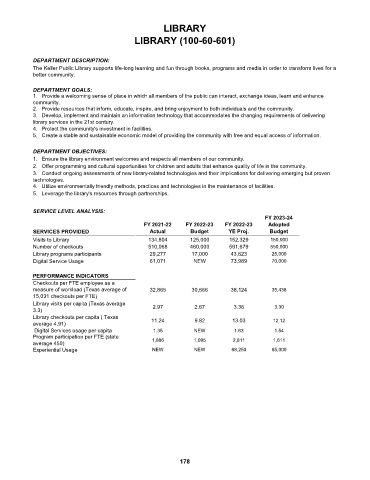
DEPARTMENT DESCRIPTION:
The Keller Public Library supports life-long learning and fun through books, programs and media in order to transform lives for a
better community.
DEPARTMENT GOALS:
1. Provide a welcoming sense of place in which all members of the public can interact, exchange ideas, learn and enhance
community.
2. Provide resources that inform, educate, inspire, and bring enjoyment to both individuals and the community.
3. Develop, implement and maintain an information technology that accommodates the changing requirements of delivering
library services in the 21st century.
4. Protect the community's investment in facilities.
5. Create a stable and sustainable economic model of providing the community with free and equal access of information.
DEPARTMENT OBJECTIVES:
1. Ensure the library environment welcomes and respects all members of our community.
2. Offer programming and cultural opportunities for children and adults that enhance quality of life in the community.
3. Conduct ongoing assessments of new library-related technologies and their implications for delivering emerging but proven
technologies.
4. Utilize environmentally friendly methods, practices and technologies in the maintenance of facilities.
5. Leverage the library's resources through partnerships.
SERVICE LEVEL ANALYSIS:
FY 2023-24
FY 2021-22 FY 2022-23 FY 2022-23 Adopted
SERVICES PROVIDED Actual Budget YE Proj. Budget
Visits to Library 134,804 125,000 152,329 150,000
Number of checkouts 510,068 460,000 591,679 550,000
Library programs participants 29,277 17,000 43,623 25,000
Digital Service Usage 61,071 NEW 73,989 70,000
PERFORMANCE INDICATORS
Checkouts per FTE employee as a
measure of workload (Texas average of 32,865 30,666 38,124 35,438
15,031 checkouts per FTE)
Library visits per capita (Texas average 2.97 2.67 3.36
3.3) 3.30
Library checkouts per capita ( Texas
average 4.91) 11.24 9.82 13.03 12.12
Digital Services usage per capita 1.35 NEW 1.63 1.54
Program participation per FTE (state
average 450) 1,886 1,095 2,811 1,611
Experiential Usage NEW NEW 68,250 65,000
178