
Page 368 - Bedford-FY23-24 Budget
P. 368
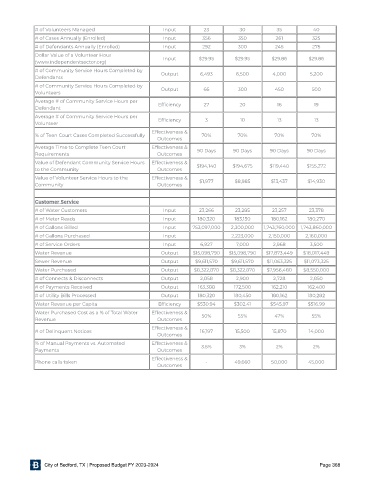
# of Volunteers Managed                   Input        23          30           35          40
             # of Cases Annually (Enrolled)            Input        356         350         261         325
             # of Defendants Annually (Enrolled)       Input        292         300         245         275
             Dollar Value of a Volunteer Hour
             (www.independentsector.org)               Input       $29.95      $29.95      $29.86      $29.86
             # of Community Service Hours Completed by  Output     6,493       6,500       4,000        5,200
             Defendants
             # of Community Service Hours Completed by  Output      66          300         450         500
             Volunteers
             Average # of Community Service Hours per
             Defendant                               Ef ciency      27          20           16          19
             Average # of Community Service Hours per  Ef ciency     3          10           13          13
             Volunteer
                                                   Effectiveness &
             % of Teen Court Cases Completed Successfully           70%         70%         70%         70%
                                                     Outcomes
             Average Time to Complete Teen Court   Effectiveness &
             Requirements                            Outcomes     90 Days     90 Days     90 Days      90 Days
             Value of Defendant Community Service Hours  Effectiveness &  $194,140  $194,675  $119,440  $155,272
             to the Community                        Outcomes
             Value of Volunteer Service Hours to the  Effectiveness &  $1,977  $8,985      $13,437     $14,930
             Community                               Outcomes


             Customer Ser vice
             # of Water Customers                      Input       23,266      23,285      23,257      23,378
             # of Meter Reads                          Input      180,320      183,150     180,162     180,270
             # of Gallons Billed                       Input     753,097,000  2,300,000  1,743,760,000  1,743,860,000
             # of Gallons Purchased                    Input                  2,223,000   2,150,000   2,160,000
             # of Service Orders                       Input       6,927       7,000       2,968        3,500
             Water Revenue                            Output     $15,098,790  $15,098,790  $17,873,449  $18,017,449
             Sewer Revenue                            Output      $9,611,570  $9,611,570  $11,063,325  $11,073,325
             Water Purchased                          Output     $8,322,870  $8,322,870  $7,956,480  $8,550,000
             # of Connects & Disconnects              Output       2,858       2,900       2,728        2,850
             # of Payments Received                   Output       163,388    172,500      162,210     162,400
             # of Utility Bills Processed             Output      180,320     180,450      180,162     180,282
             Water Revenue per Capita                Ef ciency    $530.94     $302.41     $545.97      $516.99
             Water Purchased Cost as a % of Total Water  Effectiveness &  50%   55%         47%         55%
             Revenue                                 Outcomes
                                                   Effectiveness &
             # of Delinquent Notices                               16,197      15,500      15,870      14,000
                                                     Outcomes
             % of Manual Payments vs. Automated    Effectiveness &  3.5%        3%          2%           2%
             Payments                                Outcomes
                                                   Effectiveness &
             Phone calls taken                                       -         49,660      50,000      45,000
                                                     Outcomes


                City of Bedford, TX | Proposed Budget FY 2023-2024                                         Page 368