
Page 49 - Watauga FY21 Budget
P. 49
BUDGET OVERVIEW
TABLE OF TRENDS IN ASSESSED VALUES, RATES, AND LEVIES
Tax
Year Assessed Value of Rate/$100 % Current
Ending Taxable Property of Current Year's Levy
Sept. 30 (Adjusted) valuation Tax Levy Taxes Collected Collected
2012 $ 964,172,471 0.589001 $ 5,636,137 $ 5,565,685 98.75%
2013 $ 959,370,713 0.591216 $ 5,661,880 $ 5,591,107 98.75%
2014 $ 956,468,332 0.591216 $ 5,699,054 $ 5,627,816 98.75%
2015 $ 1,016,667,348 0.591216 $ 5,986,464 $ 5,926,599 99.00%
2016 $ 1,024,630,104 0.618718 $ 6,325,757 $ 6,262,499 99.00%
2017 $ 1,157,125,543 0.618411 $ 7,051,792 $ 6,969,084 98.83%
2018 $ 1,265,325,039 0.601788 $ 7,487,384 $ 7,401,975 99.20%
2019 $ 1,382,731,351 0.601788 $ 8,040,121 $ 8,014,638 99.68%
2020 est $ 1,573,355,021 0.580500 $ 8,780,923 $ 8,693,114 99.00%
2021 est $ 1,597,254,264 0.580404 $ 8,894,923 n/a n/a
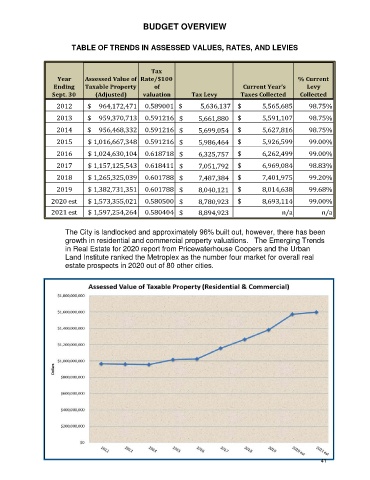
The City is landlocked and approximately 96% built out, however, there has been
growth in residential and commercial property valuations. The Emerging Trends
in Real Estate for 2020 report from Pricewaterhouse Coopers and the Urban
Land Institute ranked the Metroplex as the number four market for overall real
estate prospects in 2020 out of 80 other cities.
41