
Page 48 - Watauga FY21 Budget
P. 48
BUDGET OVERVIEW
Estimated collections for the current year have been computed at approximately 99% of
net taxable value for the Interest and Sinking (I&S) portion of the tax rate. This allows
for a slightly higher tax component to ensure that adequate funds are received to pay
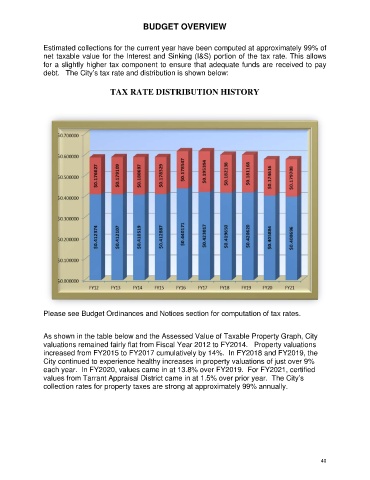
debt. The City’s tax rate and distribution is shown below:
TAX RATE DISTRIBUTION HISTORY
Please see Budget Ordinances and Notices section for computation of tax rates.
As shown in the table below and the Assessed Value of Taxable Property Graph, City
valuations remained fairly flat from Fiscal Year 2012 to FY2014. Property valuations
increased from FY2015 to FY2017 cumulatively by 14%. In FY2018 and FY2019, the
City continued to experience healthy increases in property valuations of just over 9%
each year. In FY2020, values came in at 13.8% over FY2019. For FY2021, certified
values from Tarrant Appraisal District came in at 1.5% over prior year. The City’s
collection rates for property taxes are strong at approximately 99% annually.
40