
Page 136 - Watauga FY21 Budget
P. 136
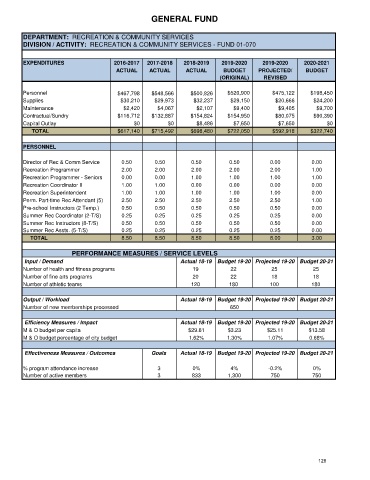
GENERAL FUND


      DEPARTMENT:  RECREATION & COMMUNITY SERVICES
      DIVISION / ACTIVITY:  RECREATION & COMMUNITY SERVICES - FUND 01-070


      EXPENDITURES                  2016-2017  2017-2018   2018-2019    2019-2020     2019-2020    2020-2021
                                     ACTUAL     ACTUAL      ACTUAL      BUDGET      PROJECTED/      BUDGET
                                                                       (ORIGINAL)     REVISED

      Personnel                       $467,798   $548,566     $500,826    $520,900       $475,122    $198,450
      Supplies                         $30,210    $29,973      $32,237     $29,150        $20,666     $24,200
      Maintenance                      $2,420      $4,067       $2,107      $9,400         $9,405      $9,700
      Contractual/Sundry              $116,712   $132,887     $154,824    $154,950        $80,075     $90,390
      Capital Outlay                       $0         $0        $8,486      $7,650         $7,650          $0
            TOTAL                     $617,140   $715,492     $698,480    $722,050       $592,918    $322,740

      PERSONNEL

      Director of Rec & Comm Service   0.50       0.50        0.50        0.50          0.00          0.00
      Recreation Programmer            2.00       2.00        2.00        2.00          2.00          1.00
      Recreation Programmer - Seniors  0.00       0.00        1.00        1.00          1.00          1.00
      Recreation Coordinator II        1.00       1.00        0.00        0.00          0.00          0.00
      Recreation Superintendent        1.00       1.00        1.00        1.00          1.00          0.00
      Perm. Part-time Rec Attendant (5)  2.50     2.50        2.50        2.50          2.50          1.00
      Pre-school Instructors (2 Temp.)  0.50      0.50        0.50        0.50          0.50          0.00
      Summer Rec Coordinator (2-T/S)   0.25       0.25        0.25        0.25          0.25          0.00
      Summer Rec Instructors (8-T/S)   0.50       0.50        0.50        0.50          0.50          0.00
      Summer Rec Assts. (5-T/S)        0.25       0.25        0.25        0.25          0.25          0.00
           TOTAL                       8.50       8.50        8.50        8.50          8.00          3.00

                                  PERFORMANCE MEASURES / SERVICE LEVELS
       Input / Demand                                     Actual 18-19  Budget 19-20 Projected 19-20 Budget 20-21
      Number of health and fitness programs                   19           22           25            25
      Number of fine arts programs                            20           22           18            18
      Number of athletic teams                                120         180           100           180


      Output / Workload                                   Actual 18-19  Budget 19-20 Projected 19-20 Budget 20-21
      Number of new memberships processed                                  650

       Efficiency Measures / Impact                       Actual 18-19  Budget 19-20 Projected 19-20 Budget 20-21
      M & O budget per capita                                $29.61       $3.23        $25.11        $13.58
      M & O budget percentage of city budget                 1.62%        1.30%        1.07%         0.68%


       Effectiveness Measures / Outcomes         Goals    Actual 18-19  Budget 19-20 Projected 19-20 Budget 20-21

      % program attendance increase                3          0%           4%          -0.2%          0%
      Number of active members                     3          833         1,300         750           750


                                                                                                        128