Page 110 - N. Richland Hills General Budget
P. 110

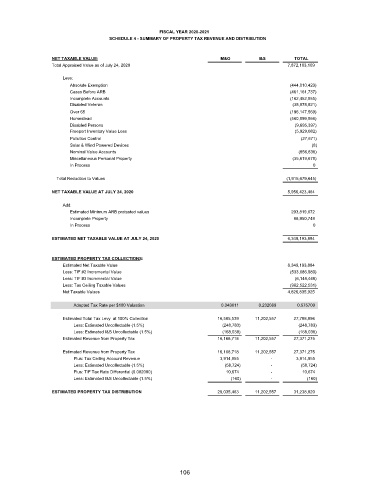
FISCAL YEAR 2020-2021
                                       SCHEDULE 4 - SUMMARY OF PROPERTY TAX REVENUE AND DISTRIBUTION


                  NET TAXABLE VALUE:                                      M&O          I&S        TOTAL
                  Total Appraised Value as of July 24, 2020                                     7,872,103,109

                      Less:
                        Absolute Exemption                                                       (444,010,423)
                        Cases Before ARB                                                         (461,161,737)
                        Incomplete Accounts                                                      (162,452,855)
                        Disabled Veteran                                                          (38,878,521)
                        Over 65                                                                  (196,147,569)
                        Homestead                                                                (560,899,866)
                        Disabled Persons                                                           (9,695,397)
                        Freeport Inventory Value Loss                                              (5,929,082)
                        Pollution Control                                                            (27,671)
                        Solar & Wind Powered Devices                                                    (8)
                        Nominal Value Accounts                                                      (856,838)
                        Miscellaneous Personal Property                                           (35,619,678)
                        In Process                                                                       0
                      Total Reduction to Values                                                 (1,915,679,645)

                  NET TAXABLE VALUE AT JULY 24, 2020                                            5,956,423,464

                      Add:
                        Estimated Minimum ARB protested values                                   293,819,672
                        Incomplete Property                                                       98,950,748
                        In Process                                                                       0

                  ESTIMATED NET TAXABLE VALUE AT JULY 24, 2020                                  6,349,193,884


                  ESTIMATED PROPERTY TAX COLLECTIONS:
                      Estimated Net Taxable Value                                               6,349,193,884
                      Less: TIF #2 Incremental Value                                             (533,686,980)
                      Less: TIF #3 Incremental Value                                               (6,148,448)
                      Less: Tax Ceiling Taxable Values                                           (982,522,531)
                      Net Taxable Values                                                        4,826,835,925
                         Adopted Tax Rate per $100 Valuation              0.343611     0.232089    0.575700

                      Estimated Total Tax Levy  at 100% Collection       16,585,539  11,202,557   27,788,096
                         Less: Estimated Uncollectable (1.5%)              (248,783)                (248,783)
                         Less: Estimated I&S Uncollectable (1.5%)          (168,038)                (168,038)
                      Estimated Revenue from Property Tax                16,168,718  11,202,557   27,371,275

                      Estimated Revenue from Property Tax                     16,168,718          11,202,557          27,371,275


                         Plus: Tax Ceiling Account Revenue                        3,914,955  -       3,914,955

                         Less: Estimated Uncollectable (1.5%)                       (58,724)  -        (58,724)
                         Plus: TIF Tax Rate Differential (0.002000)                    10,674    -   10,674

                         Less: Estimated I&S Uncollectable (1.5%)              (160)       -             (160)

                  ESTIMATED PROPERTY TAX DISTRIBUTION                         20,035,463          11,202,557          31,238,020


                                                             106
   105   106   107   108   109   110   111   112   113   114   115