Page 88 - Manfield FY21 Budget
P. 88

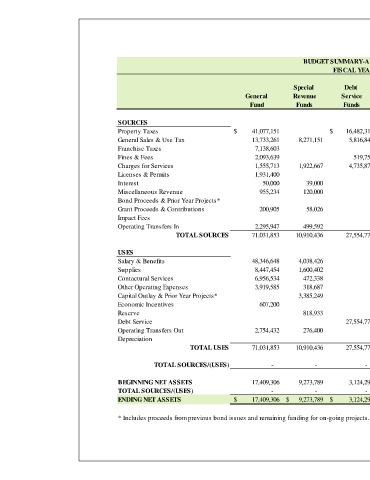
BUDGET SUMMARY-ALL FUNDS COMBINED
                                                                                                               FISCAL YEAR 2020-2021
                                                                                                                                                                 2020-2021       2019-2020        2018-2019
                                                                                                  Special          Debt           Capital                          Budget          Budget           Actual
                                                                                  General         Revenue         Service        Projects      Enterprise         All Fund         All Fund        All Fund
                                                                                    Fund           Funds           Funds          Funds*          Funds             Types           Types           Types

                                        SOURCES
                                        Property Taxes                        $             41,077,151        $          16,482,315                            $          57,559,466 $        55,024,006 $          51,306,914
                                        General Sales & Use Tax                              13,733,261           8,271,151               5,816,842                        27,821,254           26,931,221             25,974,747
                                        Franchise Taxes                                        7,138,603                                                                     7,138,603             6,414,079               7,609,435

                                        Fines & Fees                                         2,093,639                         519,750                   2,163,288                4,776,677             4,079,843               4,510,631
                                        Charges for Services                                   1,555,713           1,922,667               4,735,871            29,708,636              37,922,887           44,221,913             45,837,119

                                        Licenses & Permits                                   1,931,400                                                                       1,931,400             2,191,069               2,447,341

                                        Interest                                                  50,000                39,000                                24,000                   113,000                607,726               1,861,878
                                        Miscellaneous Revenue                                   955,234              120,000                                  55,690                1,130,924             1,272,996               3,002,494

                                        Bond Proceeds & Prior Year Projects*                                                             38,602,388                        38,602,388           56,215,989             41,497,229
                                        Grant Proceeds & Contributions                            200,905                58,026                                                 258,931                428,085               3,163,952
                                        Impact Fees                                                                                        1,800,000                         1,800,000             1,800,000               5,889,690

                                        Operating Transfers In                                 2,295,947              499,592            1,535,772                           4,331,311             4,940,301               5,403,934
                                                           TOTAL SOURCES               71,031,853         10,910,436             27,554,778          41,938,160           31,951,614            183,386,841         204,127,228           198,505,364

                                        USES
                                        Salary & Benefits                                  48,346,648           4,038,426                1,117,124             6,924,639              60,426,837           62,287,915             56,839,167


                                        Supplies                                               8,447,454           1,600,402                           17,546,895              27,594,751           29,210,163             26,691,187
                                        Contactural Services                                   6,956,534              472,338                               752,837                8,181,710             8,610,815             16,991,962
                                        Other Operating Expenses                               3,919,585              318,687                            1,077,013                5,315,285             5,385,910               5,904,397
                                        Capital Outlay & Prior Year Projects*                             3,385,249                      40,821,036                        44,206,285           60,809,491             40,413,443
                                        Economic Incentives                                       607,200                                                                       607,200                571,200               1,234,270
                                        Reserve                                                              818,933                                     3,114,283                3,933,216             4,824,365               2,782,654
                                        Debt Service                                                                      27,554,778                                       27,554,778           26,489,850             21,141,814
                                        Operating Transfers Out                                2,754,432              276,400                            2,535,947                5,566,779             5,937,519               5,403,934
                                        Depreciation                                                                                                                                                         5,082,562
                                                                TOTAL USES               71,031,853         10,910,436             27,554,778          41,938,160           31,951,614            183,386,841         204,127,228           182,485,391

                                                    TOTAL SOURCES/(USES)                           -                      -                             -                       -                         -                          -                           -              16,019,973


                                        BEGINNING NET ASSETS                                 17,409,306           9,273,789               3,124,292          36,358,130         198,057,887            264,223,404         266,880,932           250,860,959
                                        TOTAL SOURCES/(USES)                                            -                      -                             -                       -                         -                          -                           -              16,019,973
                                        ENDING NET ASSETS                     $             17,409,306 $        9,273,789 $            3,124,292 $       36,358,130 $      198,057,887  $        264,223,404 $      266,880,932 $        266,880,932


                                        * Includes proceeds from previous bond issues and remaining funding for on-going projects.

                                                                                                                                                                                                            88
   83   84   85   86   87   88   89   90   91   92   93