
Page 56 - Keller Budget FY21
P. 56
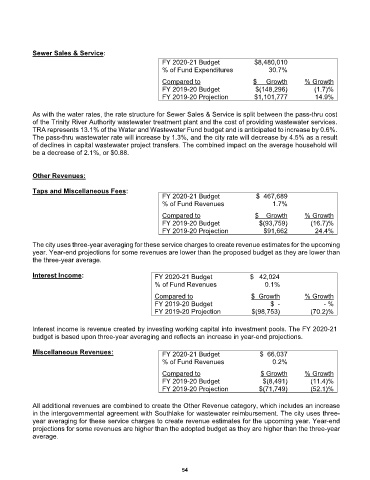
Sewer Sales & Service:
                                                       FY 2020-21 Budget               $8,480,010
                                                       % of Fund Expenditures             30.7%

                                                       Compared to                   $     Growth     % Growth
                                                       FY 2019-20 Budget              $(148,296)         (1.7)%
                                                       FY 2019-20 Projection         $1,101,777          14.9%

            As with the water rates, the rate structure for Sewer Sales & Service is split between the pass-thru cost
            of the Trinity River Authority wastewater treatment plant and the cost of providing wastewater services.
            TRA represents 13.1% of the Water and Wastewater Fund budget and is anticipated to increase by 0.6%.
            The pass-thru wastewater rate will increase by 1.3%, and the city rate will decrease by 4.5% as a result
            of declines in capital wastewater project transfers. The combined impact on the average household will
            be a decrease of 2.1%, or $0.88.


            Other Revenues:

            Taps and Miscellaneous Fees:
                                                       FY 2020-21 Budget              $  467,689
                                                       % of Fund Revenues                  1.7%
                                                       Compared to                   $    Growth      % Growth
                                                       FY 2019-20 Budget                  $(93,759)          (16.7)%
                                                       FY 2019-20 Projection               $91,662       24.4%

            The city uses three-year averaging for these service charges to create revenue estimates for the upcoming
            year. Year-end projections for some revenues are lower than the proposed budget as they are lower than
            the three-year average.

            Interest Income:                        FY 2020-21 Budget                  $   42,024
                                                    % of Fund Revenues                   0.1%

                                                    Compared to                     $  Growth         % Growth
                                                    FY 2019-20 Budget                     $  -                - %
                                                    FY 2019-20 Projection           $(98,753)           (70.2)%

            Interest income is revenue created by investing working capital into investment pools. The FY 2020-21
            budget is based upon three-year averaging and reflects an increase in year-end projections.

            Miscellaneous Revenues:                    FY 2020-21 Budget               $  66,037
                                                       % of Fund Revenues                  0.2%

                                                       Compared to                     $ Growth       % Growth
                                                       FY 2019-20 Budget                  $(8,491)       (11.4)%
                                                       FY 2019-20 Projection            $(71,749)       (52.1)%

            All additional revenues are combined to create the Other Revenue category, which includes an increase
            in the intergovernmental agreement with Southlake for wastewater reimbursement. The city uses three-
            year averaging for these service charges to create revenue estimates for the upcoming year. Year-end
            projections for some revenues are higher than the adopted budget as they are higher than the three-year
            average.


                                                                54