
Page 55 - Keller Budget FY21
P. 55
WATER AND WASTEWATER FUND
Revenue Assumptions:
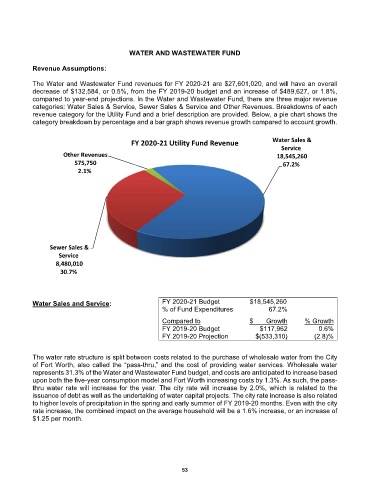
The Water and Wastewater Fund revenues for FY 2020-21 are $27,601,020, and will have an overall
decrease of $132,584, or 0.5%, from the FY 2019-20 budget and an increase of $489,627, or 1.8%,
compared to year-end projections. In the Water and Wastewater Fund, there are three major revenue
categories: Water Sales & Service, Sewer Sales & Service and Other Revenues. Breakdowns of each
revenue category for the Utility Fund and a brief description are provided. Below, a pie chart shows the
category breakdown by percentage and a bar graph shows revenue growth compared to account growth.
FY 2020‐21 Utility Fund Revenue Water Sales &
Service
Other Revenues 18,545,260
575,750 67.2%
2.1%
Sewer Sales &
Service
8,480,010
30.7%
Water Sales and Service: FY 2020-21 Budget $18,545,260
% of Fund Expenditures 67.2%
Compared to $ Growth % Growth
FY 2019-20 Budget $117,962 0.6%
FY 2019-20 Projection $(533,310) (2.8)%
The water rate structure is split between costs related to the purchase of wholesale water from the City
of Fort Worth, also called the “pass-thru,” and the cost of providing water services. Wholesale water
represents 31.3% of the Water and Wastewater Fund budget, and costs are anticipated to increase based
upon both the five-year consumption model and Fort Worth increasing costs by 1.3%. As such, the pass-
thru water rate will increase for the year. The city rate will increase by 2.0%, which is related to the
issuance of debt as well as the undertaking of water capital projects. The city rate increase is also related
to higher levels of precipitation in the spring and early summer of FY 2019-20 months. Even with the city
rate increase, the combined impact on the average household will be a 1.6% increase, or an increase of
$1.25 per month.
53