
Page 47 - Keller Budget FY21
P. 47
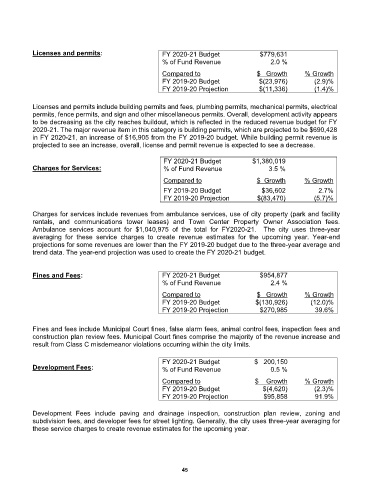
Licenses and permits:                      FY 2020-21 Budget               $779,631
                                                       % of Fund Revenue                   2.0 %

                                                       Compared to                    $   Growth      % Growth
                                                       FY 2019-20 Budget                 $(23,976)        (2.9)%
                                                       FY 2019-20 Projection             $(11,336)          (1.4)%

            Licenses and permits include building permits and fees, plumbing permits, mechanical permits, electrical
            permits, fence permits, and sign and other miscellaneous permits. Overall, development activity appears
            to be decreasing as the city reaches buildout, which is reflected in the reduced revenue budget for FY
            2020-21. The major revenue item in this category is building permits, which are projected to be $690,428
            in FY 2020-21, an increase of $16,905 from the FY 2019-20 budget. While building permit revenue is
            projected to see an increase, overall, license and permit revenue is expected to see a decrease.

                                                       FY 2020-21 Budget             $1,380,019
            Charges for Services:                      % of Fund Revenue                  3.5 %

                                                       Compared to                    $  Growth       % Growth
                                                       FY 2019-20 Budget                 $36,602           2.7%
                                                       FY 2019-20 Projection            $(83,470)           (5.7)%

            Charges for services include revenues from ambulance services, use of city property (park and facility
            rentals,  and  communications  tower  leases)  and  Town  Center  Property  Owner  Association  fees.
            Ambulance  services  account  for  $1,040,975  of  the  total  for  FY2020-21.    The  city  uses  three-year
            averaging  for  these  service  charges  to  create  revenue  estimates  for  the  upcoming  year.  Year-end
            projections for some revenues are lower than the FY 2019-20 budget due to the three-year average and
            trend data. The year-end projection was used to create the FY 2020-21 budget.


            Fines and Fees:                            FY 2020-21 Budget               $954,877
                                                       % of Fund Revenue                   2.4 %

                                                                                                      % Growth
                                                                                      $   Growth
                                                       Compared to                      $(130,926)         (12.0)%
                                                       FY 2019-20 Budget
                                                       FY 2019-20 Projection             $270,985          39.6%


            Fines and fees include Municipal Court fines, false alarm fees, animal control fees, inspection fees and
            construction plan review fees. Municipal Court fines comprise the majority of the revenue increase and
            result from Class C misdemeanor violations occurring within the city limits.

                                                       FY 2020-21 Budget             $   200,150
            Development Fees:                          % of Fund Revenue                   0.5 %

                                                       Compared to                   $    Growth      % Growth
                                                       FY 2019-20 Budget                 $(4,620)        (2.3)%
                                                       FY 2019-20 Projection             $95,858         91.9%

            Development  Fees  include  paving  and  drainage  inspection,  construction  plan  review,  zoning  and
            subdivision fees, and developer fees for street lighting. Generally, the city uses three-year averaging for
            these service charges to create revenue estimates for the upcoming year.


                                                                45