
Page 82 - Hurst Budget FY21
P. 82
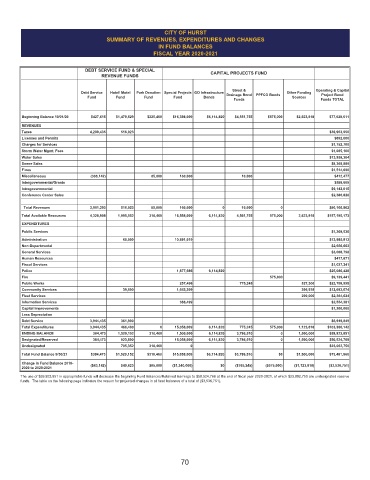
CITY OF HURST
                                    SUMMARY OF REVENUES, EXPENDITURES AND CHANGES
                                                     IN FUND BALANCES
                                                    FISCAL YEAR 2020-2021


                             DEBT SERVICE FUND & SPECIAL               CAPITAL PROJECTS FUND
                                   REVENUE FUNDS

                                                                              Street &                   Operating & Capital
                            Debt Service   Hotel/ Motel     Park Donation   Special Projects  GO Infrastructure   Other Funding   Project Bond
                              Fund     Fund      Fund     Fund      Bonds   Drainage Bond   PPFCO Bonds  Sources
                                                                              Funds                        Funds TOTAL

        Beginning Balance 10/01/20  $427,615  $1,479,529  $225,460  $16,398,009  $6,114,820  $4,551,755  $575,000  $2,623,818  $77,028,611
        REVENUES
        Taxes                  4,209,435  516,023                                                             $39,963,950
        Licenses and Permits                                                                                    $892,000
        Charges for Services                                                                                   $1,752,700
        Storm Water Mgmt. Fees                                                                                 $1,085,100
        Water Sales                                                                                           $13,959,304
        Sewer Sales                                                                                            $8,308,889
        Fines                                                                                                  $1,514,690
        Miscellaneous          (308,142)           85,000   160,000              10,000                         $412,477
        Intergovernmental/Grants                                                                                $598,609
        Intragovernmental                                                                                      $9,142,015
        Conference Center Sales                                                                                $2,386,828
          Total Revenues       3,901,293  516,023  85,000   160,000        0     10,000       0               $80,166,562
        Total Available Resources  4,328,908  1,995,552  310,460  16,558,009  6,114,820  4,561,755  575,000  2,623,818  $157,195,173
        EXPENDITURES
        Public Services                                                                                        $1,269,536
        Administration                    65,000           10,891,019                                         $13,985,813
        Non-Departmental                                                                                       $2,656,663
        General Services                                                                                       $3,008,798
        Human Resources                                                                                         $417,671
        Fiscal Services                                                                                        $1,037,241
        Police                                             1,877,686  6,114,820                               $25,086,428
        Fire                                                                              575,000              $9,139,441
        Public Works                                        257,496             775,245              527,300  $23,758,595
        Community Services                39,500           1,643,309                                 396,518  $12,693,674
        Fleet Services                                                                               200,000   $2,364,624
        Information Services                                388,499                                            $2,554,381
        Capital Improvements                                                                                   $1,200,000
        Less Depreciation
        Debt Service           3,944,435  361,900                                                              $6,949,849
        Total Expenditures     3,944,435  466,400     0    15,058,009  6,114,820  775,245  575,000  1,123,818  $103,386,142
        ENDING BALANCE          384,473  1,529,152  310,460  1,500,000  6,114,820  3,786,510  0     1,500,000  $59,923,851
        Designated/Reserved     384,473  823,800           15,058,009  6,114,820  3,786,510   0     1,500,000  $50,524,768
        Undesignated                     705,352  310,460       0                                             $23,002,750
        Total Fund Balance 9/30/21  $384,473  $1,529,152  $310,460  $15,058,009  $6,114,820  $3,786,510  $0  $1,500,000  $73,491,860
        Change in Fund Balance 2019-  ($43,142)  $49,623  $85,000  ($1,340,000)  $0  ($765,245)  ($575,000)  ($1,123,818)  ($3,536,751)
        2020 to 2020-2021
        The use of $59,923,851 in appropriable funds will decrease the beginning Fund Balances/Retained Earnings to $50,524,768 at the end of fiscal year 2020-2021, of which $23,002,750 are undesignated reserve
        funds.  The table on the following page indicates the reason for projected changes in all fund balances of a total of ($3,536,751).