
Page 81 - Hurst Budget FY21
P. 81
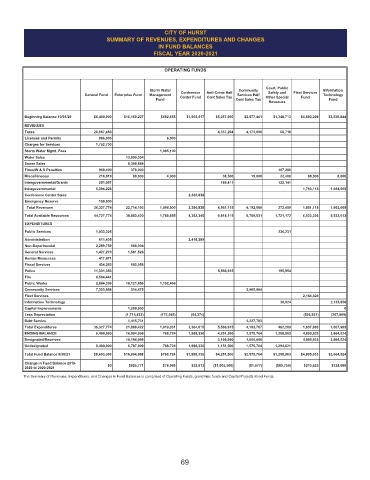
CITY OF HURST
                                    SUMMARY OF REVENUES, EXPENDITURES AND CHANGES
                                                     IN FUND BALANCES
                                                    FISCAL YEAR 2020-2021


                                                       OPERATING FUNDS


                                                                                         Court, Public
                                                   Storm Water                  Community                   Information
                                                             Conference
                                                                                          Safety and
                             General Fund  Enterprise Fund  Management   Center Fund  Anti-Crime Half   Services Half   Other Special   Fleet Services   Technology
                                                                                                     Fund
                                                                     Cent Sales Tax
                                                     Fund                      Cent Sales Tax                 Fund
                                                                                          Revenues
         Beginning Balance 10/01/20  $8,400,000  $16,169,227  $692,655  $1,965,517   $5,257,000  $2,577,441  $1,348,713  $4,682,208  $3,539,844
         REVENUES
         Taxes                  26,667,480                               4,337,204  4,173,090  60,718
         Licenses and Permits     886,000               6,000
         Charges for Services    1,752,700
         Storm Water Mgmt. Fees                       1,085,100
         Water Sales                       13,959,304
         Sewer Sales                       8,308,889
         Fines/W & S Penalties    969,490   378,000                                          167,200
         Miscellaneous            216,819    68,000     4,900              38,500   19,000    22,400   88,000    8,000
         Intergovernmental/Grants  291,057                                185,411            122,141
         Intragovernmental       5,394,228                                                           1,763,118  1,984,669
         Conference Center Sales                               2,386,828
         Emergency Reserve        150,000
           Total Revenues       36,327,774  22,714,193  1,096,000  2,386,828  4,561,115  4,192,090  372,459  1,851,118  1,992,669
         Total Available Resources  44,727,774  38,883,420  1,788,655  4,352,345  9,818,115  6,769,531  1,721,172  6,533,326  5,532,513
         EXPENDITURES
         Public Services         1,033,305                                                   236,231
         Administration           611,405                      2,418,389
         Non-Departmental        2,289,759  366,904
         General Services        1,427,270  1,581,528
         Human Resources          417,671
         Fiscal Services          434,283   602,958
         Police                 11,331,353                               5,566,615           195,954
         Fire                    8,564,441
         Public Works            2,884,399  18,121,659  1,192,496
         Community Services      7,333,888  314,475                               2,965,984
         Fleet Services                                                                              2,164,624
         Information Technology                                                               30,024          2,135,858
         Capital Improvements              1,200,000                                                               0
         Less Depreciation                 (1,714,833)  (172,565)  (54,374)                          (526,931)  (267,869)
         Debt Service                      1,415,731                               1,227,783
         Total Expenditures     36,327,774  21,888,422  1,019,931  2,364,015  5,566,615  4,193,767  462,209  1,637,693  1,867,989
         ENDING BALANCE          8,400,000  16,994,998  768,724  1,988,330  4,251,500  2,575,764  1,258,963  4,895,633  3,664,524
         Designated/Reserved               10,196,999                    3,100,000  1,000,000        4,895,633  3,664,524
         Undesignated            8,400,000  6,797,999  768,724  1,998,330  1,151,500  1,575,764  1,294,621
         Total Fund Balance 9/30/21  $8,400,000  $16,994,998  $768,724  $1,998,330   $4,251,500   $2,575,764  $1,258,963   $4,895,633  $3,664,524
         Change in Fund Balance 2019-  $0   $825,771   $76,069  $32,813  ($1,005,500)  ($1,677)  ($89,750)  $213,425  $124,680
         2020 to 2020-2021
         The Summary of Revenues, Expenditures, and Changes in Fund Balances is comprised of Operating Funds, grant/misc funds and Capital Projects Bond Funds.


                                                             6