
Page 80 - Hurst Budget FY21
P. 80
All Operating Funds Continued
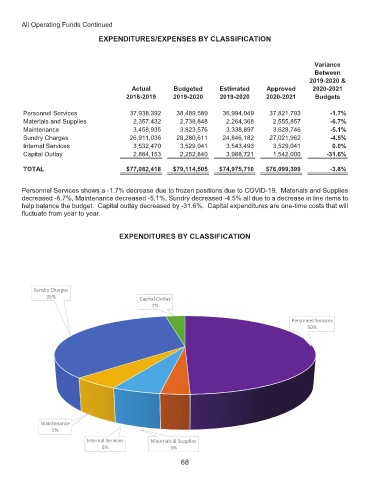
EXPENDITURES/EXPENSES BY CLASSIFICATION
Variance
Between
2019-2020 &
Actual Budgeted Estimated Approved 2020-2021
2018-2019 2019-2020 2019-2020 2020-2021 Budgets
Personnel Services 37,938,392 38,489,589 36,994,049 37,821,793 -1.7%
Materials and Supplies 2,357,432 2,738,848 2,264,368 2,555,857 -6.7%
Maintenance 3,458,935 3,823,576 3,338,897 3,628,746 -5.1%
Sundry Charges 26,911,036 28,280,611 24,846,182 27,021,962 -4.5%
Internal Services 3,532,470 3,529,041 3,543,493 3,529,041 0.0%
Capital Outlay 2,884,153 2,252,840 3,988,721 1,542,000 -31.6%
TOTAL $77,082,418 $79,114,505 $74,975,710 $76,099,399 -3.8%
Personnel Services shows a -1.7% decrease due to frozen positions due to COVID-19. Materials and Supplies
decreased -6.7%, Maintenance decreased -5.1%, Sundry decreased -4.5% all due to a decrease in line items to
help balance the budget. Capital outlay decreased by -31.6%. Capital expenditures are one-time costs that will
fluctuate from year to year.
EXPENDITURES BY CLASSIFICATION
Sundry Charges
35%
Capital Outlay
2%
Personnel Services
50%
Maintenance
5%
Internal Services Materials & Supplies
5% 3%
6