
Page 272 - Hurst Budget FY21
P. 272
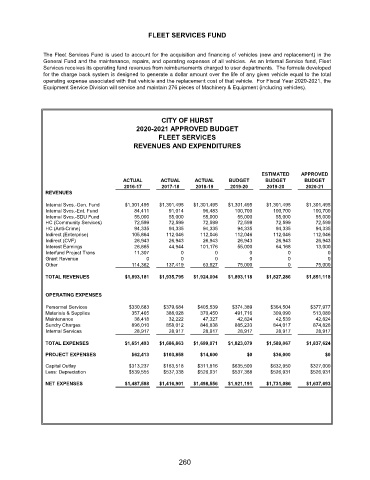
FLEET SERVICES FUND


               The Fleet Services Fund is used to account for the acquisition and financing of vehicles (new and replacement) in the
               General Fund and the maintenance, repairs, and operating expenses of all vehicles. As an Internal Service fund, Fleet
               Services receives its operating fund revenues from reimbursements charged to user departments. The formula developed
               for the charge back system is designed to generate a dollar amount over the life of any given vehicle equal to the total
               operating expense associated with that vehicle and the replacement cost of that vehicle. For Fiscal Year 2020-2021, the
               Equipment Service Division will service and maintain 276 pieces of Machinery & Equipment (including vehicles).


                                                      CITY OF HURST
                                              2020-2021 APPROVED BUDGET
                                                     FLEET SERVICES
                                             REVENUES AND EXPENDITURES


                                                                                        ESTIMATED    APPROVED
                                          ACTUAL      ACTUAL     ACTUAL      BUDGET      BUDGET       BUDGET
                                          2016-17     2017-18     2018-19    2019-20     2019-20      2020-21
                REVENUES

                Internal Svcs.-Gen. Fund  $1,301,495  $1,301,495  $1,301,495  $1,301,495  $1,301,495  $1,301,495
                Internal Svcs.-Ent. Fund     84,411      91,014     96,483     100,700     100,700       100,700
                Internal Svcs.-SDU Fund      55,000      55,000     55,000      55,000      55,000       55,000
                HC (Community Services)      72,599      72,599     72,599      72,599      72,599       72,599
                HC (Anti-Crime)              94,335      94,335     94,335      94,335      94,335       94,335
                Indirect (Enterprise)        105,864    112,046    112,046     112,046     112,046       112,046
                Indirect (CVF)               26,943      26,943     26,943      26,943      26,943       26,943
                Interest Earnings            26,865      44,944    101,176      55,000      64,168       13,000
                Interfund Project Trans      11,307          0          0           0           0            0
                Grant Revenue                    0           0          0           0           0            0
                Other                        114,362    137,419     63,927      75,000          0        75,000
                TOTAL REVENUES            $1,893,181  $1,935,795  $1,924,004  $1,893,118  $1,827,286  $1,851,118


                OPERATING EXPENSES

                Personnel Services          $330,683   $379,684   $405,539    $374,389     $364,504     $377,977
                Materials & Supplies         357,465    388,028    370,450     491,716     309,090       513,080
                Maintenance                  38,418      32,222     47,327      42,824      42,539       42,824
                Sundry Charges               896,010    858,012    846,838     885,233     844,017       874,826
                Internal Services            28,917      28,917     28,917      28,917      28,917       28,917
                TOTAL EXPENSES            $1,651,493  $1,686,863  $1,699,071  $1,823,079  $1,589,067  $1,837,624

                PROJECT EXPENSES             $62,413   $103,858    $14,600         $0      $36,000           $0
                Capital Outlay              $313,237   $163,518   $311,816    $635,500     $632,950     $327,000
                Less: Depreciation          $539,555   $537,338   $526,931    $537,388     $526,931     $526,931
                NET EXPENSES              $1,487,588  $1,416,901  $1,498,556  $1,921,191  $1,731,086  $1,637,693


                                                            260