
Page 48 - Haltom City Budget FY21
P. 48
CITY OF HALTOM CITY ANNUAL BUDGET, FY2021 BUDGET OVERVIEW
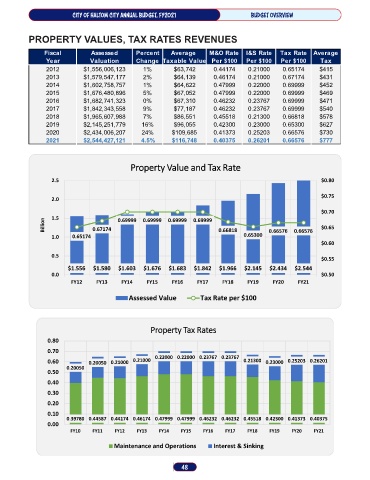
PROPERTY VALUES, TAX RATES REVENUES
Fiscal Assessed Percent Average M&O Rate I&S Rate Tax Rate Average
Year Valuation Change Taxable Value Per $100 Per $100 Per $100 Tax
2012 $1,556,006,123 1% $63,742 0.44174 0.21000 0.65174 $415
2013 $1,579,547,177 2% $64,139 0.46174 0.21000 0.67174 $431
2014 $1,602,758,757 1% $64,622 0.47999 0.22000 0.69999 $452
2015 $1,676,480,896 5% $67,052 0.47999 0.22000 0.69999 $469
2016 $1,682,741,323 0% $67,310 0.46232 0.23767 0.69999 $471
2017 $1,842,343,558 9% $77,187 0.46232 0.23767 0.69999 $540
2018 $1,965,607,988 7% $86,551 0.45518 0.21300 0.66818 $578
2019 $2,145,251,779 16% $96,055 0.42300 0.23000 0.65300 $627
2020 $2,434,006,207 24% $109,685 0.41373 0.25203 0.66576 $730
2021 $2,544,427,121 4.5% $116,748 0.40375 0.26201 0.66576 $777
Property Value and Tax Rate
2.5 $0.80
$0.75
2.0
$0.70
1.5 0.69999 0.69999 0.69999 0.69999
Billion 0.67174 0.66818 0.66576 0.66576 $0.65
1.0 0.65174 0.65300
$0.60
0.5 $0.55
$1.556 $1.580 $1.603 $1.676 $1.683 $1.842 $1.966 $2.145 $2.434 $2.544
0.0 $0.50
FY12 FY13 FY14 FY15 FY16 FY17 FY18 FY19 FY20 FY21
Assessed Value Tax Rate per $100
Property Tax Rates
0.80
0.70
0.22000 0.22000 0.23767 0.23767
0.60 0.20050 0.21000 0.21000 0.21300 0.23000 0.25203 0.26201
0.20050
0.50
0.40
0.30
0.20
0.10 0.39780 0.44587 0.44174 0.46174 0.47999 0.47999 0.46232 0.46232 0.45518 0.42300 0.41373 0.40375
0.00
FY10 FY11 FY12 FY13 FY14 FY15 FY16 FY17 FY18 FY19 FY20 FY21
Maintenance and Operations Interest & Sinking
48