
Page 43 - Haltom City Budget FY21
P. 43
CITY OF HALTOM CITY ANNUAL BUDGET, FY2021 BUDGET OVERVIEW
WHERE THE MONEY COMES FROM - BY REVENUE TYPE
Actual EOY Estimated Budget Change from FY2020 to FY2021
Revenue FY2019 FY2020 FY2021 Amount Percent
Property Taxes $14,605,833 17,149,000 16,534,918 ($614,082) -4%
Sales & Other Taxes 15,459,775 14,469,759 14,675,399 205,640 1%
Franchise 3,984,933 3,374,865 3,698,000 323,135 10%
Licenses & Permits 1,155,715 1,721,150 2,271,414 550,264 32%
Intergovernmental 34,160 1,343,903 401,990 (941,913) -70%
Charges For Service 25,948,524 26,509,810 26,936,346 426,536 2%
Fines & Fees 1,345,910 796,425 980,720 184,295 23%
Bond Proceeds 8,586,994 - 5,980,000 5,980,000 N/A
Other 2,646,624 2,291,251 1,581,280 (709,971) -31%
Transfers 5,928,688 10,666,130 10,750,403 84,273 1%
Total $79,697,156 $78,322,293 $83,810,470 $5,488,177 7%
MAJOR SOURCE OF REVENUES
Major sources of revenue are taxes, licenses and charges for operating funds, and bond proceeds
for capital improvement funds.
Taxes and Franchise include property tax, sales and use taxes, and franchise fees. Property tax
estimates are based on current property values, new construction, tax rate and recent collection
rates. Estimates for taxes were budgeted conservatively due to the Covid-19 Pandemic and
the uncertainty of long-term effects and next year’s economic outlook. Historic growth is used
to forecast franchise fees, but the changes in telecommunication fees will lower the amount of
franchise fees that can be charged in the future.
Licenses & Permits, Charges for Services and Fine & Fees include licenses, permits, charges
for services, and fines. Trend analysis is used to project all charges for services.
Intergovernmental revenues are grants from other governmental entities. The City receives
grants for Streets, Police, Fire, Drainage, Parks and Library.
Other revenues are donations, interest income and other miscellaneous revenues.
Transfers are transactions between funds. Transfers include administrative fees, fleet service
fees, debt service payments and billing fees.
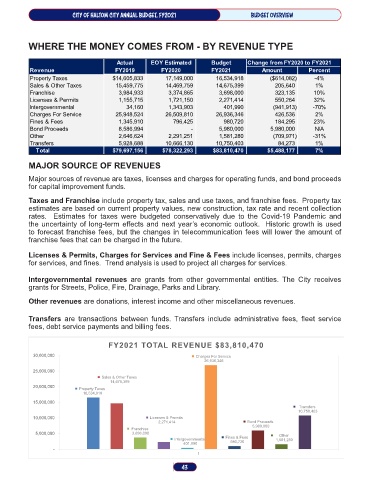
FY2021 TOTAL REVENUE $83,810,470
30,000,000 Charges For Service
26,936,346
25,000,000
Sales & Other Taxes
14,675,399
20,000,000
Property Taxes
16,534,918
15,000,000
Transfers
10,750,403
10,000,000 Licenses & Permits
2,271,414 Bond Proceeds
5,980,000
Franchise
5,000,000 3,698,000 Other
Intergovernmental Fines & Fees 1,581,280
401,990 980,720
-
1
43