
Page 52 - Haltom City Budget FY21
P. 52
CITY OF HALTOM CITY ANNUAL BUDGET, FY2021 BUDGET OVERVIEW
CHARGES FOR SERVICES
Charges for services include all fees and charges for services provided by the City such as inspec-
tion, facility rentals, reports, parks and recreation, garage sales, water and sewer, and drainage.
Outlook
Total revenue from Charges for Services for FY2021 is estimated to decrease by about 8% due to
adjustments to permitting fees. No rate changes were made in water and sewer rates, however,
there will be additional accounts with new neighborhood.
Major Influence
Factors affecting charges for services revenues include population, activities, and usage.
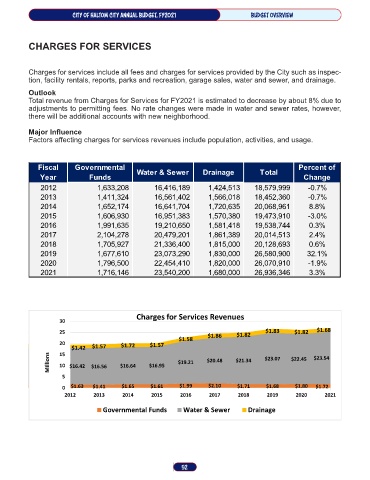
Fiscal Governmental Percent of
Year Funds Water & Sewer Drainage Total Change
2012 1,633,208 16,416,189 1,424,513 18,579,999 -0.7%
2013 1,411,324 16,561,402 1,566,018 18,452,360 -0.7%
2014 1,652,174 16,641,704 1,720,635 20,068,961 8.8%
2015 1,606,930 16,951,383 1,570,380 19,473,910 -3.0%
2016 1,991,635 19,210,650 1,581,418 19,538,744 0.3%
2017 2,104,278 20,479,201 1,861,389 20,014,513 2.4%
2018 1,705,927 21,336,400 1,815,000 20,128,693 0.6%
2019 1,677,610 23,073,290 1,830,000 26,580,900 32.1%
2020 1,796,500 22,454,410 1,820,000 26,070,910 -1.9%
2021 1,716,146 23,540,200 1,680,000 26,936,346 3.3%
Charges for Services Revenues
30
25 $1.86 $1.82 $1.83 $1.82 $1.68
$1.58
20 $1.72 $1.57
$1.42 $1.57
15
Millions 10 $16.42 $16.56 $16.64 $16.95 $19.21 $20.48 $21.34 $23.07 $22.45 $23.54
5
0 $1.63 $1.41 $1.65 $1.61 $1.99 $2.10 $1.71 $1.68 $1.80 $1.72
2012 2013 2014 2015 2016 2017 2018 2019 2020 2021
Governmental Funds Water & Sewer Drainage
52