Page 39 - Grapevine Budget FY21
P. 39

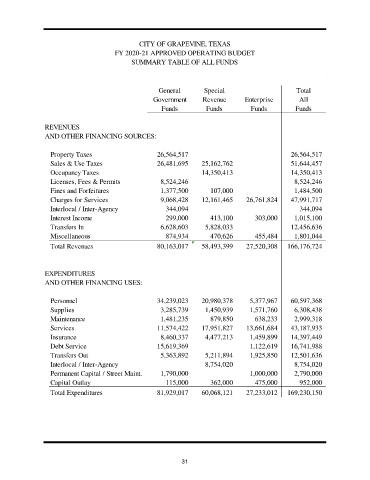
CITY OF GRAPEVINE, TEXAS
                                       FY 2020-21 APPROVED OPERATING BUDGET
                                             SUMMARY TABLE OF ALL FUNDS


                                                      General        Special                       Total
                                                    Government      Revenue       Enterprise        All
                                                      Funds          Funds          Funds          Funds


                REVENUES
                AND OTHER FINANCING SOURCES:


                  Property Taxes                     26,564,517                                  26,564,517
                  Sales & Use Taxes                  26,481,695     25,162,762                   51,644,457
                  Occupancy Taxes                                   14,350,413                   14,350,413
                  Licenses, Fees & Permits            8,524,246                                   8,524,246
                  Fines and Forfeitures               1,377,500        107,000                    1,484,500
                  Charges for Services                9,068,428     12,161,465    26,761,824     47,991,717
                  Interlocal / Inter-Agency             344,094                                     344,094
                  Interest Income                       299,000        413,100       303,000      1,015,100
                  Transfers In                        6,628,603      5,828,033                   12,456,636
                  Miscellaneous                         874,934        470,626       455,484      1,801,044
                  Total Revenues                     80,163,017     58,493,399    27,520,308    166,176,724


                EXPENDITURES
                AND OTHER FINANCING USES:


                  Personnel                          34,239,023     20,980,378      5,377,967    60,597,368
                  Supplies                            3,285,739      1,450,939      1,571,760     6,308,438
                  Maintenance                         1,481,235        879,850       638,233      2,999,318
                  Services                           11,574,422     17,951,827    13,661,684     43,187,933
                  Insurance                           8,460,337      4,477,213      1,459,899    14,397,449
                  Debt Service                       15,619,369                     1,122,619    16,741,988
                  Transfers Out                       5,363,892      5,211,894      1,925,850    12,501,636
                  Interlocal / Inter-Agency                          8,754,020                    8,754,020
                  Permanent Capital / Street Maint.   1,790,000                     1,000,000     2,790,000
                  Capital Outlay                        115,000        362,000       475,000        952,000
                  Total Expenditures                 81,929,017     60,068,121    27,233,012    169,230,150


                                                             31
   34   35   36   37   38   39   40   41   42   43   44