Page 37 - Grapevine Budget FY21
P. 37

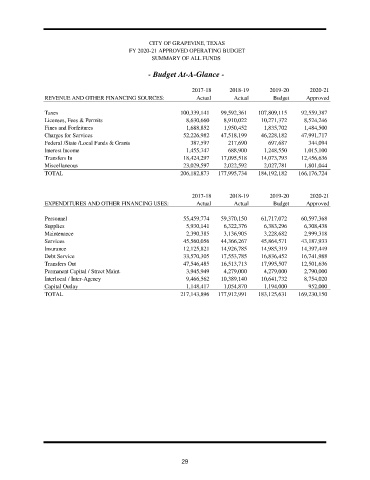
CITY OF GRAPEVINE, TEXAS
                                            FY 2020-21 APPROVED OPERATING BUDGET
                                                   SUMMARY OF ALL FUNDS

                                                  - Budget At-A-Glance -


                                                                 2017-18     2018-19      2019-20       2020-21
                REVENUE AND OTHER FINANCING SOURCES:              Actual      Actual       Budget     Approved

                Taxes                                        100,339,141  99,592,361  107,809,115    92,559,387
                Licenses, Fees & Permits                       8,630,660   8,910,022   10,271,372     8,524,246
                Fines and Forfeitures                          1,688,852   1,950,452    1,835,702     1,484,500
                Charges for Services                          52,226,982  47,518,199   46,228,182    47,991,717
                Federal /State /Local Funds & Grants            387,597     217,690       697,687      344,094
                Interest Income                                1,455,747    688,900     1,248,550     1,015,100
                Transfers In                                  18,424,297  17,095,518   14,073,793    12,456,636
                Miscellaneous                                 23,029,597   2,022,592    2,027,781     1,801,044
                TOTAL                                        206,182,873  177,995,734  184,192,182  166,176,724


                                                                 2017-18     2018-19      2019-20       2020-21
                EXPENDITURES AND OTHER FINANCING USES:            Actual      Actual       Budget     Approved

                Personnel                                     55,459,774  59,370,150   61,717,072    60,597,368
                Supplies                                       5,930,141   6,322,376    6,383,296     6,308,438
                Maintenance                                    2,390,385   3,136,905    3,228,682     2,999,318
                Services                                      45,560,056  44,366,267   45,864,571    43,187,933
                Insurance                                     12,125,821  14,926,785   14,985,319    14,397,449
                Debt Service                                  33,570,305  17,553,785   16,836,452    16,741,988
                Transfers Out                                 47,546,485  16,513,713   17,995,507    12,501,636
                Permanent Capital / Street Maint.              3,945,949   4,279,000    4,279,000     2,790,000
                Interlocal / Inter-Agency                      9,466,562  10,389,140   10,641,732     8,754,020
                Capital Outlay                                 1,148,417   1,054,870    1,194,000      952,000
                TOTAL                                        217,143,896  177,912,991  183,125,631  169,230,150


                                                             29
   32   33   34   35   36   37   38   39   40   41   42