
Page 49 - Dalworthington Gardens FY21 Budget
P. 49
09/17/2020
ENTERPRISE FUND P&L DETAILS 2018-19 2019-20 2019-20 2019-20 2020-21 FY 20/21
Budget
% of vs
Original Adopted Over/(Under) Projected FY 19/20
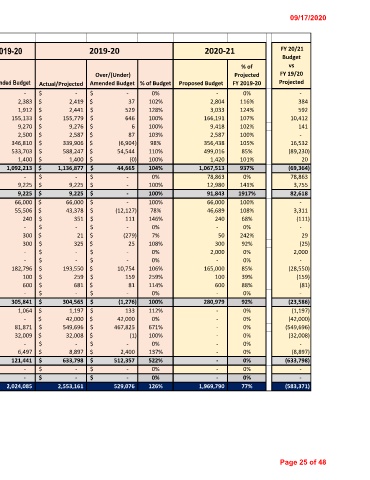
Account Number Account Description ACTUAL Budget Amended Budget Actual/Projected Amended Budget % of Budget Proposed Budget FY 2019-20 Projected
40.7440 Contractual:Janitor Services 1,686 - - $ - $ - 0% - 0% -
40.7505 Contractual:Liability Insur 7,505 2,383 2,383 $ 2,419 $ 37 102% 2,804 116% 384
40.7510 Contractual:Worker's Compens 3,660 1,912 1,912 $ 2,441 $ 529 128% 3,033 124% 592
40.7600 Contractual:Refuse Collectio 147,188 153,400 155,133 $ 155,779 $ 646 100% 166,191 107% 10,412
40.7601 Contractual:Haz Waste Collection 2,315 9,270 9,270 $ 9,276 $ 6 100% 9,418 102% 141
40.7605 Contractual:Water System Fee 2,587 2,600 2,500 $ 2,587 $ 87 103% 2,587 100% -
40.7615 Contractual:Sewer Treatment 272,590 354,469 346,810 $ 339,906 $ (6,904) 98% 356,438 105% 16,532
40.7650 Contractual:Water Purchase 649,389 562,892 533,703 $ 588,247 $ 54,544 110% 499,016 85% (89,230)
40.7655 Contractual:Water Testing 1,553 1,400 1,400 $ 1,400 $ (0) 100% 1,420 101% 20
Total Contractual 1,123,217 1,112,087 1,092,213 $ 1,136,877 $ 44,665 104% 1,067,513 937% (69,364)
40.7834 Capital Lease: Principal Expense - - - $ - $ - 0% 78,863 0% 78,863
40.7835 Capital Lease: Interest Expense - 9,225 9,225 $ 9,225 $ - 100% 12,980 141% 3,755
Total Debt - 9,225 9,225 $ 9,225 $ - 100% 91,843 1917% 82,618
40.8005 W/S ROW Cost Recovery Fee 66,000 66,000 66,000 $ 66,000 $ - 100% 66,000 100% -
40.8006 W/S Overhead Cost Recovery Fee - 45,372 55,506 $ 43,378 $ (12,127) 78% 46,689 108% 3,311
40.8010 Other:Membership &Dues 885 240 240 $ 351 $ 111 146% 240 68% (111)
40.8020 Other:Meetings - - - $ - $ - 0% - 0% -
40.8025 Other:Mileage Reimbursement 124 300 300 $ 21 $ (279) 7% 50 242% 29
40.8028 OtherLCell Phone Reimbursement 300 600 300 $ 325 $ 25 108% 300 92% (25)
40.8030 Other:Northern Trinity GWCD 13 - - $ - $ - 0% 2,000 0% 2,000
40.8040 Other:Bank Fees - - - $ - $ - 0% - 0% -
40.8060 Other:Depreciation Exp 158,755 155,506 182,796 $ 193,550 $ 10,754 106% 165,000 85% (28,550)
40.8070 Other:Miscellaneous - 100 100 $ 259 $ 159 259% 100 39% (159)
40.8085 Other:Interest on Cash Deficit 5,114 4,800 600 $ 681 $ 81 114% 600 88% (81)
40.8100 Other:Cash-Short/Over - - - $ - $ - 0% - 0% -
Total Other 231,192 272,917 305,841 $ 304,565 $ (1,276) 100% 280,979 92% (23,586)
40.9010 Capital Outlay-Computer/Off Eq - 1,064 1,064 $ 1,197 $ 133 112% - 0% (1,197)
40.9100 Capital Outlay-Vehicles - - - $ 42,000 $ 42,000 0% - 0% (42,000)
40.9200 Capital Outlay - Water System - 225,000 81,871 $ 549,696 $ 467,825 671% - 0% (549,696)
40.9205 Capital Outlay - Sewer System - - 32,009 $ 32,008 $ (1) 100% - 0% (32,008)
40.9015 Capital Outlay:Bldgs/Grounds - - - $ - $ - 0% - 0% -
40.9350 Capital Outlay - Equipment - - 6,497 $ 8,897 $ 2,400 137% - 0% (8,897)
Total Capital Outlay - 226,064 121,441 $ 633,798 $ 512,357 522% - 0% (633,798)
40.9700 Transfer Out - 14,583 - $ - $ - 0% - 0% -
Total Other Uses - 14,583 - $ - $ - 0% - 0% -
TOTAL EXPENSES 1,788,600 2,058,346 2,024,085 2,553,161 529,076 126% 1,969,790 77% (583,371)
Page 25 of 48