
Page 163 - Colleyville FY21 Budget
P. 163
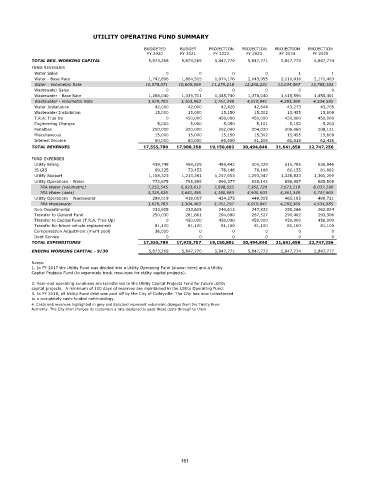
UTILITY OPERATING FUND SUMMARY

                                                 BUDGETED    BUDGET   PROJECTION  PROJECTION  PROJECTION  PROJECTION
                                                  FY 2020    FY 2021    FY 2022    FY 2023   FY 2024    FY 2025
            TOTAL BEG. WORKING CAPITAL            5,873,268  5,873,269  5,847,770  5,847,771  5,847,772  5,847,774
           FUND REVENUES
             Water Sales                                0          0          0          0          1          1
             Water - Base Rate                    1,742,896  1,864,515  1,974,176  2,043,955  2,110,916  2,171,403
             Water - Volumetric Rate             10,578,071  10,605,069  11,279,218  12,268,231  13,034,567  13,785,183
             Wastewater Sales                           0          0          0          0          0          0
             Wastewater - Base Rate               1,268,040  1,339,711  1,345,740  1,378,040  1,415,594  1,455,401
             Wastewater - Volumetric Rate         3,629,783  3,303,963  3,761,298  4,010,841  4,283,369  4,534,585
             Water Installation                     42,000     42,000     42,420     42,844     43,273     43,705
             Wastewater Installation                15,000     15,000     15,150     15,302     15,455     15,609
             T.R.A. True Up                             0     450,000    450,000    450,000    450,000    450,000
             Engineering Charges                     5,000      5,000      5,050      5,101      5,152      5,203
             Penalties                             200,000    200,000    202,000    204,020    206,060    208,121
             Miscellaneous                          15,000     15,000     15,150     15,302     15,455     15,609
             Interest Income                        60,000     60,000     60,600     61,206     61,818     62,436
            TOTAL REVENUES                      17,555,790  17,900,258  19,150,802  20,494,840  21,641,658  22,747,256
           FUND EXPENSES
             Utility Billing                       438,748    469,229    485,442    500,329    515,785    530,846
             IS GIS                                 69,235     73,453     76,146     78,188     80,155     81,882
             Utility Support                      1,168,323  1,213,381  1,257,653  1,293,347  1,328,833  1,361,200
             Utility Operations - Water            772,875    795,589    800,377    828,142    856,997    885,508
                 TRA Water (volumetric)           7,252,545  6,923,612  7,098,555  7,362,728  7,673,218  8,037,280
                 TRA Water (debt)                 3,325,526  3,681,456  4,180,663  4,905,503  5,361,349  5,747,903
             Utility Operations - Wastewater       298,019    418,007    434,275    449,305    465,185    480,721
                 TRA Wastewater                   3,629,783  3,304,463  3,761,297  4,010,841  4,283,369  4,534,585
             Non-Departmental                      233,605    233,605    240,613    247,832    255,266    262,924
             Transfer to General Fund              250,030    281,861    284,680    287,527    290,402    293,306
             Transfer to Capital Fund (T.R.A. True Up)  0     450,000    450,000    450,000    450,000    450,000
             Transfer for future vehicle replacement  81,100   81,100     81,100     81,100     81,100     81,100
             Compensation Adjustment (merit pool)   36,000         0          0          0          0          0
             Debt Service                               0          0          0          0          0          0
            TOTAL EXPENDITURES                  17,555,789  17,925,757  19,150,801  20,494,840  21,641,658  22,747,256
            ENDING WORKING CAPITAL - 9/30         5,873,269  5,847,770  5,847,771  5,847,772  5,847,774  5,847,777

           Notes:
           1. In FY 2017 the Utility Fund was divided into a Utility Operating Fund (shown here) and a Utility
           Capital Projects Fund (to separately track resources for utility capital projects).
           2. Year-end operating surpluses are transferred to the Utility Capital Projects Fund for future utility
           capital projects.  A minimum of 100 days of reserves are maintained in the Utility Operating Fund.
           3. In FY 2018, all Utility Fund debt was paid off by the City of Colleyville. The City has now transitioned
           to a completely cash-funded methodology.
           4. Costs and revenues highlighted in grey and italicized represent volumetric charges from the Trinity River
           Authority. The City then charges its customers a rate designed to pass those costs through to them.


                                                             161